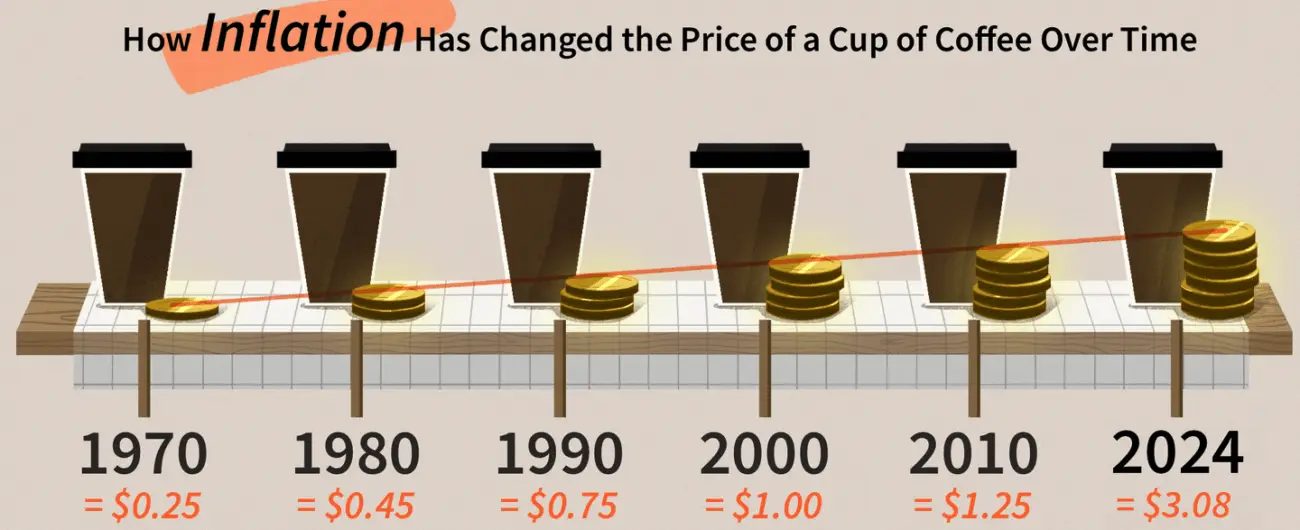
- Meaning of Inflation
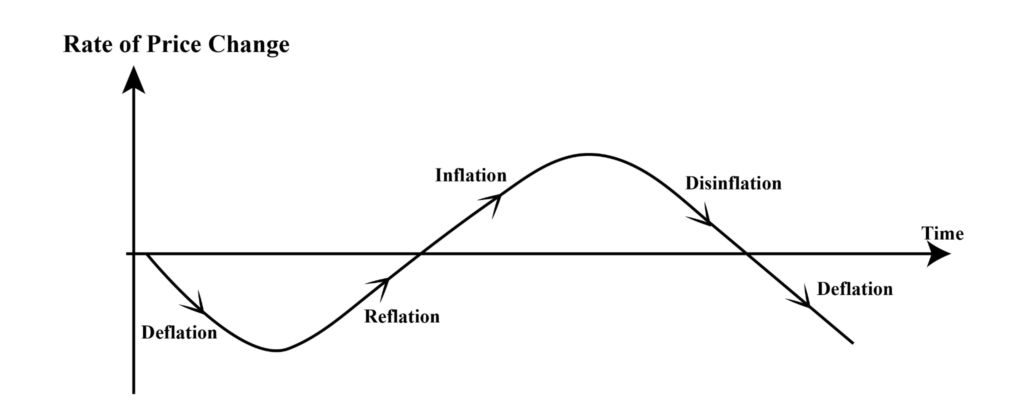
- Deflation, Reflation and Disinflation
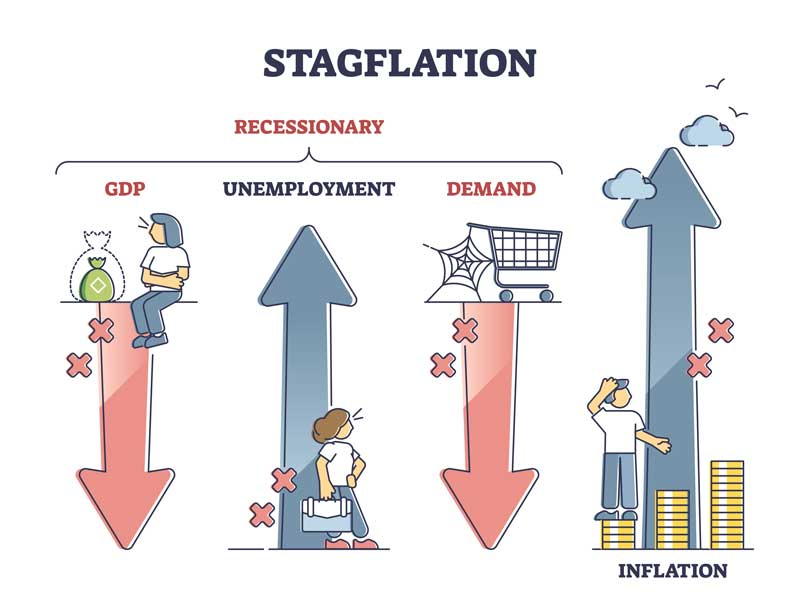
- Stagflation
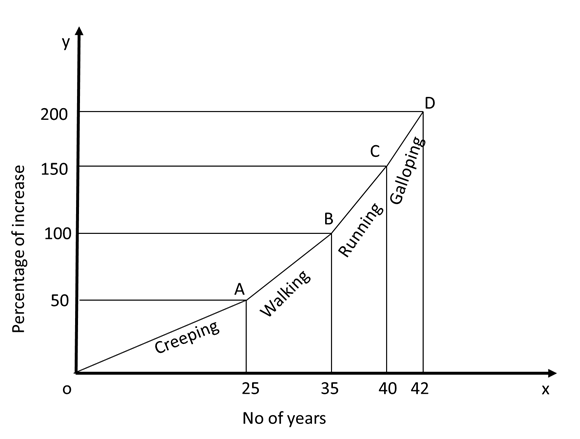
- Types of Inflation
- Classification of Inflation based on Origin
- Impact of Inflation
- Various Measures of Inflation(WPI, CPI, GDP Deflator, SPI)
- Producer Price Index
- Index of Industrial Production
- Purchase Managers Index.
“Inflation, public enemy number one” – Gerald Ford
Inflation
“Inflation means that your money won’t buy as much today as you could yesterday“
Inflation reduces the purchasing power of money. It hurts the poor more as a greater proportion of their incomes are needed to pay for their consumption. Inflation reduces the savings, pushes up interest rates, dampens investment, leads to depreciation of currency thus making imports costlier.
Deflation: Deflation is the reverse of inflation. It refers to a sustained decline in the price level of goods and services. It occurs when the annual inflation rate falls below zero percent (a negative inflation rate), resulting in an increase in the real value of money. Japan suffered from deflation for almost a decade in 1990s.
Q) Which one of the following statements is an appropriate description of deflation?
(a) It is a sudden fall in the value of a currency against other currencies
(b) It is a persistent recession in both the financial and real sectors of economy
(c) It is a persistent fall in the general price level of goods and services
(d) It is a fall in the rate of inflation over a period of time
Reflation: Reflation is an act of stimulating the economy by reducing taxes or by increasing the money supply. Which usually occurs after a period of economic uncertainty or a recession.
To curb the effects of deflation, a monetary or fiscal policy is designed by the Government or Central Bank to stimulate spending and expand output, thereby resulting in increase in prices and contain the phenomenon of Deflation.
Disinflation: It is the rate of change of inflation over time. The inflation rate is declining over time, but it remains positive.
Eg: If the inflation rate in the India was 5% in January but decreases to 4% in March, it is said to be experiencing disinflation in the first quarter of the year.
Stagflation
Stagflation is an economic cycle in which there is a high rate of both inflation and stagnation. Inflation occurs when the general level of prices in an economy increases.
Stagnation occurs when the production of goods and services in an economy slows down or even starts to decline. It’s a period of no growth or even an economic contraction, or shrinking of an economy.
Stagnation causes a high degree of unemployment because you don’t need employees if you aren’t producing. Stagflation is a very serious problem because the usual tools we use to fix inflation tend to make stagnation and unemployment worse, while the tools we use to fix stagnation and unemployment tend to make inflation worse.
Types of Inflation:
Low inflation: can be characterized from 1% to 5%. Around zero there is no inflation (price stability). Below zero, a country faces deflation.
Moderate inflation: can be differently defined around the world, given the different inflation histories. As an indication only, one could consider an inflation as moderate when it ranges from 5% to 25-30%. For some countries, the higher part of this range is already “high inflation”.
Creeping Inflation: known as mild inflation or moderate inflation. This type of inflation occurs when the price level persistently rises over a period of time at a mild rate. When the rate of inflation is less than 10 per cent annually, or it is a single digit inflation rate, it is considered to be a moderate inflation.
High inflation: is a situation of price increase of, say, 30%-50% a year. Extremely high inflation could range anywhere between 50% and 100%. Both kinds can be stable or dangerously accelerate to enter in an hyperinflation condition.
Hyperinflation: is the most extreme inflation phenomenon, with yearly price increases of three-digits percentage points and an explosive acceleration.
Galloping Inflation: If mild inflation is not checked and if it is uncontrollable, it may assume the character of galloping inflation. Inflation in the double or triple digit range of 20, 100 or 200 percent a year is called galloping inflation. Many Latin American countries such as Argentina, Brazil had inflation rates of 50 to 700 percent per year in the 1970s and 1980s.
Classification of Inflation based on its origin
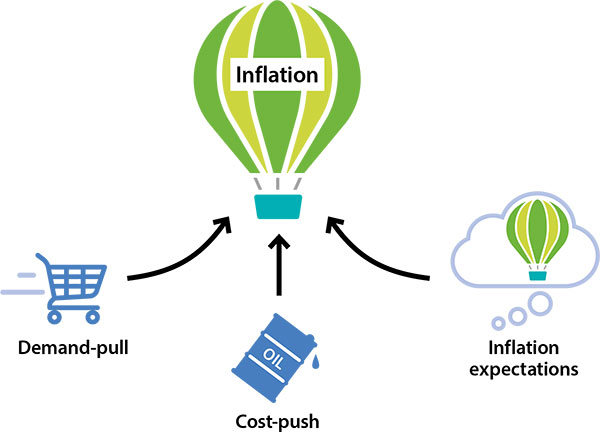
Cost -Push inflation:
Cost push inflation is caused by rise in the prices of inputs like power, labour, raw materials etc. Price rise of inputs in the form of increased raw material cost, electricity charges or wage rate (including a rise in profit margin made by the producer) results in increased cost and ultimately to increased price of the product.
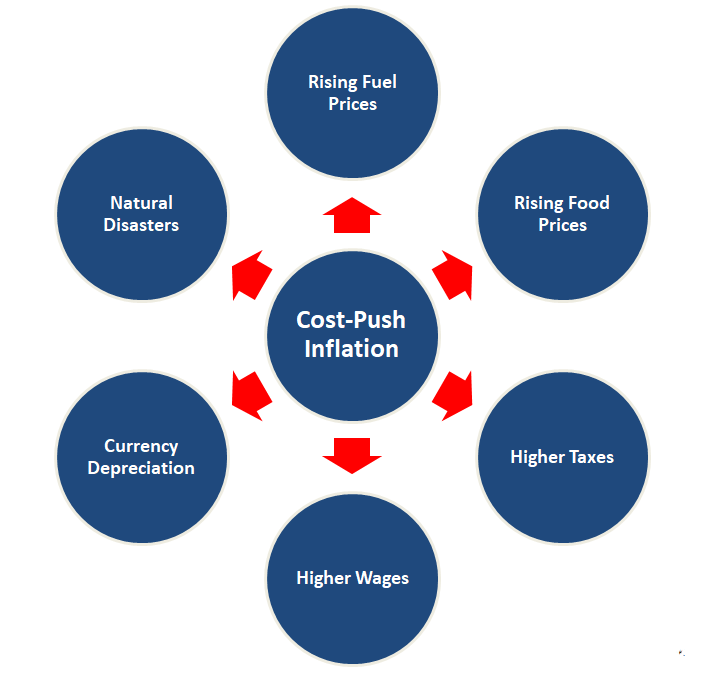
Example: The rising price of coal which immediately may cause price rise in industries which use coal. Price rise of key inputs like crude oil products may trigger price spiralling effect on other goods and services. In India, cost push inflation is the major supply side factor producing inflation.
Cost Push Factors:
1. Infrastructure bottlenecks which lead rise in production and distribution costs.
2. Rise in Minimum Support Price (MSP).
3. Rise in international prices.
4. Hoarding and black marketing.
5. Rise in indirect taxes.
How it can be addressed?
An important factor about cost push inflation is that it can’t be managed by monetary policy intervention by the RBI, like an increase in repo rate. The ideal way to tackle production related cost push inflation is to initiate measures to augment the production of commodities.
Similarly, imports also can be resorted to contain cost push inflation. There are several conventional measures to handle cost push inflation- providing incentives like subsidies, tax cuts, and launching production boosting programmes like National Food Security Mission.
Demand-pull inflation: Demand pull inflation is caused by increased demand in the economy, without adequate increase in supply of output. It is mainly an outcome of excess money income with the people. This high money income would be due to increased money supply. The situation of “too much money chasing too few goods” is an instance of demand pull inflation.

Demand Pull Factors:
1. Rise in population.
2. Black money.
3. Rise in income.
4. Excessive government expenditure.
Q) Economic growth is usually coupled with
(a) Deflation
(b) Inflation
(c) Stagflation
(d) Hyperinflation
Q) With reference to demand-pull inflation can be caused by increased by which of the following
1. Expansionary policies
2. Fiscal stimulus
3. Inflation-indexing wages
4. Higher purchasing power
5. Rising interest rates
Select the correct answer using the code given below,
(a) 1, 2 and 4 only
(b) 3, 4 and 5 only
(c) 1, 2, 3 and 5 only
(d) 1, 2, 3, 4 and 5
How it can be addressed?
Monetary policy is best fit to tackle demand pull inflation. An increase in repo rate(policy rate) will decrease demand for loans for consumption and production and in this way it will reduce the demand for commodities. Similarly, additional taxation by the government and reduced public expenditure are also good for demand management.
Why Low inflation is good for the business:
- When inflation is low, consumers and businesses are better able to make long-range plans because they know that the purchasing power of their money will hold and will not be steadily eroded year after year.
- Low inflation also means lower nominal and real (inflation-adjusted) interest rates. Lower real interest rates reduce the cost of borrowing. This encourages households to buy durable goods, such as houses and autos. It also encourages businesses to invest in order to improve productivity so that they can stay competitive and prosper without steadily having to raise prices.
- Sustained low inflation is self-reinforcing. If businesses and individuals are confident that inflation is under long-term control, they do not react as quickly to short-term price pressures by seeking to raise prices and wages. This helps to keep inflation low.
Structural Inflation: A type of persistent inflation caused by deficiencies in certain conditions in the economy such as a backward agricultural sector that is unable to respond to people’s increased demand for food, inefficient distribution and storage facilities leading to artificial shortages of goods, and production of some goods controlled by some people.
It is prevalent in the Developing and Low-Income Countries mainly due to the weak structure of their economies. As a result of these imperfections, some sectors of the economy like agriculture will witness shortages of supply, whereas some sectors like consumer goods will witness excessive demand.
Such economies face the problem of both shortages of supply, underutilization of resources as well as excessive demand in some sectors.
For Example: In India, let’s assume that the farmer produces fruits and vegetables at Rs. 5000 per quintal. But the final consumer gets the same at Rs.10000 per quintal. The huge disparity between what farmer receives and consumer pays is due to infrastructure and agriculture bottlenecks. The bottleneck arises mainly due to lack of roads, highways, cold chains and underdeveloped agriculture markets. All these increases the cost of transporting goods from farmers to consumers leading to inflation.
Note: Structural Inflation can arise due to the government’s monetary policy rather than to supply of and demand for goods and services. Inflation that occurs because a government pursues an excessively loose monetary policy. That is, if a central bank prints too much money or keeps interest rates too low for too long.
Q) A rise in general level of prices may be caused by
1. An increase in the money supply
2. A decrease in the aggregate level of output
3. An increase in the effective demand
Select the correct answer using the codes given below.
(a) 1 only
(b) 1 and 2 only
(c) 2 and 3 only
(d) 1, 2 and 3
Nominal Income Vs Real Income: Nominal Income simply refers to the earnings of the individual. Whereas real income is inflation adjusted income of the individual.
Let’s try to understand the concept with simple example, imagine your salary is Rs.1,00,00 per month and it remained same for a year, if the inflation rate in the economy is 5% on an average, the purchasing power of your income decreases due to inflation, i.e., the basket of goods and service your nominal income can purchase is not the same.
Nominal Interest Rate Vs Real Interest Rate:
Like nominal and real income, nominal interest rate is the interest promised by the borrower, real interest rate is inflation adjusted interest rate.
The simplest way of adjusting to inflation is,
Real interest rate = Nominal interest rate – Rate of inflation.
Effects of Inflation
On Aggregate Demand: Rising prices usually results in reducing aggregate demand due to decreasing purchasing power of the people, as more and more money needed to purchase fewer basket of goods., reducing spending capacity of people.
Simply put, since the real income of people decreases due to high rates of inflation, the overall demand in the economy shrinks.
On Creditors and Debtors: Inflation redistributes wealth from lenders (Banks) to borrowers (common man) i.e. lenders suffer and borrowers benefit from inflation as real interest rates fall due to high inflation rates.
Q) Consider the following statements:
1. Inflation benefits the debtors.
2. Inflation benefits the bondholders.
Which of the statements given above is/are correct?
(a) 1 only
(b) 2 only
(c) Both 1 and 2
(d) Neither 1 nor 2
On Savings: In the long run, rising prices depletes the saving rate in an economy as people prefer holding /spending money than saving due to decrease in real interest rates.
On Investment: Inflation increases the investment in an economy in the short run as it encourages producers to expand or increase production as increase in prices acts as incentive to the producers. But, in the long run inflation decreases the investment as producers have no incentive to increase the production due to fall in aggregate demand.
On Exports: With inflation, people abroad have to pay more for the goods which they were buying from your country. So your exports will decrease.
On Imports: With high inflation rate in domestic economy people demand more and more cheaper goods from abroad. So your imports will increase.
On Exchange Rate: Rising prices generally leads to depreciation of the currency which implies that the currency loses its exchange value in front of a foreign currency. As exports fall and imports rise. But this is relative to the pressure on the foreign currency against which the exchange rate is compared.
For instance, from 2013 till mid-2014, even though there was relatively high inflation in India, still it did not lose much value vis-a-vis the US dollar since the dollar was also under inflationary pressure.
On Wages: Inflation increases the nominal or face value of the wages while its real value falls. Simply put, even though wages may increase to offset inflation the actual value of money falls.
Fiscal drag: When an economy is rapidly expanding, inflation results in higher income and therefore individuals moving into higher tax brackets and paying more of their income in taxes. This is particularly the case in economies with progressive taxes, or tax brackets, which stipulate that the higher income an individual makes the higher the tax they pay and thus they move into a higher tax bracket.
Moving into a higher tax bracket and paying a larger portion of income in taxes, as mentioned prior, results in an eventual slowing of the economy as there is now less income available for discretionary spending.
It is common to view fiscal drag as a natural economic stabilizer as it tends to keep demand stable and the economy from overheating. This is generally viewed as a mild deflationary policy and a positive aspect to fiscal drag.
Inflation measuring Indices
Inflation rate of a country is the rate at which prices of goods and services increase in its economy.
It is an indication of the rise in the general level of prices over time.
Since, it’s practically impossible to find out the average change in prices of all the goods and services traded in an economy (which would give comprehensive inflation rate) due to the sheer number of goods and services present, a sample set or a basket of goods and services is used to get an indicative figure of the change in prices, which we call the inflation rate.
Mathematically, inflation or inflation rate is calculated as the percentage rate of change of a certain price index.
Wholesale Price Index (WPI):
WPI is the index that is used to measure the change in the average price level of goods traded in wholesale market.
WPI in India is published by the Office of Economic Adviser, Ministry of Commerce and Industry. An, important point to take note of is the wholesale price index (WPI) does not includes the cost of services.
Further, as WPI accounts for changes in general price level of goods at wholesale level, it fails to communicate actual burden borne by the end consumer.
Q) The current Price Index (base 1960) is nearly 330. This means that the price of: 1987
(a) All items cost 3.3 times more than what they did in 1960
(b) The price of certain selected items have gone up to 3.3 times
(c) Weighted mean of price of certain items has increased 3.3 times
(d) Gold price has gone up 33 times
Characteristics of Wholesale Price Index are as follows:-
- The various commodities taken into consideration for computing the WPI can be categorized into primary article, fuel and power, and manufactured goods.
- Primary articles included for the computation of WPI include food articles, non-food articles and minerals.
- In the fuel, power, light and lubricants, electricity, coal mining and mineral oil are included.
- The manufactured goods category encompasses food products; beverages, tobacco, and tobacco products; wood and wood products, textiles; paper and paper products; basic metals and alloys; rubber and rubber products and many others.
- A new WPI series with 2011-12 base year with 676 items in the commodity basket was released. Previously, WPI used a sample set of 435 commodities as an indicator of movement in prices of commodities in all trade and transactions.
- At present the different categories included primary articles, fuel and power and manufactured products bear 22.62%, 13.15% and 64.23% weight age. With 102 items in the primary articles, 19 in fuel and power and in manufactured products that cover primarily all items transacted in the Indian economy.
- The prices are taken from wholesale market.
- It is also the price index which is available on a weekly basis.
- It has the shortest possible time lag of only two weeks ie the data available in the current week is calculated on the basis of prices two weeks back.
WPI is the primary measure that is used by the Indian central government for ascertaining inflation as WPI in contrast to CPI accounts for changes in price at an early distribution stage. WPI index in fact includes all transactions at first point of bulk sale in the domestic market.
Consumer Price Index (CPI):
A comprehensive measure used for estimation of price changes in a basket of goods and services representative of consumption expenditure in an economy is called consumer price index. Inflation in India right now is measured using CPI.
The percentage change in this index over a period of time gives the amount of inflation over that specific period, i.e. the increase in prices of a representative basket of goods consumed.
What is CPI?
Consumer Price Index or CPI is the measure of changes in the price level of a basket of consumer goods and services bought by households. CPI is a numerical estimation calculated using the rates of a sample of representative objects the prices of which are gathered periodically.
- The CPI captures changes in price level at the consumer level.
- Changes in prices at the producer level are tracked by the Wholesale Price Index (WPI).
- CPI can capture the change in the prices of services which the WPI cannot.
Candidates should know that CPI is different than WPI. Candidates can read about Wholesale Price Index (WPI)in the linked article.
How is CPI calculated?
The Consumer Price Index or CPI assesses the changes in the price of a common basket of goods and services by comparing with the prices that are prevalent during the same period in a previous year.
The formula for calculating CPI is:
CPI = (Cost of basket in a given year / Cost of basket in base year) x 100
Types of CPI
|
CPI for Industrial Workers (CPI-IW) |
|
|
CPI for Agricultural Labourers (CPI-AL) |
|
|
CPI for Rural Labourer (CPI-RL) |
|
|
CPI ( Urban Non-Manual Employees) (CPI-UNME) |
CSO is under the Ministry of Statistics and Program Implementation |
Note: CPI for Agricultural and Rural labourers on base 1986-87=100 is a weighted average of 20 constituent state indices and it measures the extent of change in the retail prices of goods and services consumed by the agricultural and rural labourers as compared with the base period viz ‘86-87. This index is released on the 20th of the succeeding month.
Q) Which of the following brings out the ‘Consumer Price Index Number for industrial Workers’?
(a) The Reserve Bank of India
(b) The Department of Economic Affairs
(c) The Labour Bureau
(d) The Department of Personnel and Training
Difference between WPI and CPI
For common people, i.e. consumers, it is the CPI that is most relevant. CPI also covers the service sector. Therefore, the RBI linked CPI for fixing interest rates in India.
|
Basis For Comparison |
Wholesale Price Index (WPI) |
Consumer Price Index (CPI) |
|
Meaning |
WPI, amounts to the average change in prices of commodities at wholesale level |
CPI, indicates the average change in the prices of commodities, at the retail level. |
|
Published by |
Office of Economic Advisor (Ministry of Commerce & Industry) |
Central Statistics Office (Ministry of Statistics and Programme Implementation) |
|
Measures prices of |
Goods only |
Goods and Services both |
|
Measurement of Inflation |
The first stage of the transaction |
The final stage of the transaction |
|
Prices paid by |
Manufacturers and wholesalers |
Consumers |
|
How many items covered |
697 (Primary, fuel & power and manufactured products) |
448(Rural Basket) 460 (Urban Basket) |
|
What type of items covered |
Manufacturing inputs and intermediate goods like minerals, machinery basic metals etc. |
Education, communication, transportation, recreation, apparel, foods and beverages, housing and medical care |
|
Base year |
2011-12 |
2012 |
|
Used by |
Only a few countries including India |
157 countries |
|
Data released on |
Primary articles, fuel and power (Weekly basis) & overall (monthly basis since 2012) |
Monthly basis |
Q) With reference to India, consider the following statements:
1. The Wholesale Price Index (WPI) in India is available on a monthly basis only.
2. As compared to Consumer Price Index for Industrial Workers (CPIIW), the WPI gives less weight to food articles.
Which of the statements given above is/are correct?
(a) 1 only
(b) 2 only
(c) Both 1 and 2
(d) Neither 1 nor 2
WPI Inflation Vs CPI Inflation: Which should you keep in mind? For the common man it is always better to keep retail inflation which is the CPI or the Consumer Price Inflation number in mind. It is a better measurement of what is largely happening with consumer prices.
WPI inflation on the other hand is better known to individuals who track the wholesale prices and is of better significance to them. In any case both are a measure of inflation.
CPI-WPI divergence:
CPI inflation has always been higher than WPI inflation, the divergence has been growing.
The reasons: The CPI inflation being higher than WPI inflation has been that food articles had a higher weight (48.3 per cent) in CPI than in WPI (24.3 per cent). This factor plays an important role, whenever the primary trigger of inflation is food inflation.
Non-food inflation according to WPI and CPI have very different composition.
Fuel and power category has a much bigger weight in WPI (14.9 per cent) than in CPI (6.8 per cent). There are certain items which figure in CPI but do not figure in WPI. These may be broadly treated as ‘services’.
Why CPI a better inflation indicator than WPI?
Retail inflation price rise driven by potential consumer demand and available supply is a better indicator of inflation for guiding monetary policy decisions than WPI inflation. RBI chose the wholesale price index or WPI over CPI before 2014, largely for two reasons.
- First, until 2011, there was no single CPI, representative of the whole country. There were three or four CPI measures, relevant for different segments of population.
- Second, WPI was earlier available with a shorter lag only a 2-week delay compared with CPI inflation which came with a 2-month lag.
What changed after 2014:
- Now, we have one representative measure of retail inflation CPI (combined) with further disaggregation to see how prices in rural and urban India are changing.
- Now, CPI monthly inflation data is released couple of days prior to WPI inflation data for the same month.
Based on the recommendations of Urjit R. Patel Committee report new CPI (combined) adopted as the key measure of inflation from 2014 first bi-monthly policy by RBI.
How it is good move:
WPI excludes prices of services such as education, healthcare, and rents. However, services now account for nearly 60 per cent of GDP and a vast majority of these services are not traded with other countries. As a result, inflation in these services is largely determined by the domestic demand-supply situation.
Conversely, the new CPI measure assigns nearly 36% weightage on services and includes price changes in housing, education, healthcare, transport and communication, personal care and entertainment.
WPI assigns nearly 15% and 10.7% weightage for the fuel group and metal and metal products group, respectively. Any sharp movements in international prices of fuels and metals, therefore, lead to sharp changes in WPI. This was visible in calendar year 2009 when WPI inflation fell below 2%, in 8 out of 12 months.
A sharp decline in WPI resulted in a swift and sharp lowering of the repo rate to 4.75% by April 2009 from 9% in July 2008. During the same year, CPI (industrial workers) inflation averaged nearly 11%.
Such differences in coverage and weightage in WPI and CPI at times lead to diverging trends and make it difficult to gauge the underlying inflationary pressures.
Q) India has experienced persistent and high food inflation in the recent past. What could be the reasons?
1. Due to a gradual switchover to the cultivation of commercial crops, the area under the cultivation of food grains has steadily decreased in the last five years by about 30 %.
2. As a consequence of increasing incomes, the consumption patterns of the people have undergone a significant change.
3. The food supply chain has structural constraints.
Which of the statements given above are correct?
(a) 1 and 2 only
(b) 2 and 3 only
(c) 1 and 3 only
(d) 1,2 and 3
Q) Consider the following statements.
1. The weightage of food in Consumer Price Index (CPI) is higher than that in Wholesale Price Index (WPI).
2. The WPI does not capture changes in the prices of services, which CPI does.
3. Reserve Bank of India has now adopted WPI as its key measure of inflation and to decide on changing interest rates
Which of the statements given- above is/are correct?
(a) 1 and 2 only
(b) 2 only
(c) 3 only 4
(d) 1,2 and 3
GDP Deflator: It is measured as ratio of GDP (Gross Domestic Product) at current prices to GDP at constant prices. It encompasses the entire spectrum of economic activities including services, the scope and coverage of national income deflator is wider than any other measure. This data is released by the Central Statistical Organisation (CSO) but is not used as it comes quarterly and with a 2 month lag.
GDP Deflator = (Nominal GDP/Real GDP) x 100
CPI vs GDP Deflator:
CPI and GDP deflator generally seem to be the same thing but they have some few key differences. Both are used to determine price inflation and reflect the current economic state of a particular nation.
GDP Deflator takes into account goods that are produced domestically. It does not bother with imported goods and it reflects the prices of all the commodities, services included. The GDP deflator is calculated quarterly and it weights may change per calculation.
The GDP deflator is based on all goods produced in an economy, whereas the consumer price index focuses on those items that typical households purchase, regardless of whether they are produced domestically.
The CPI assigns fixed weights to the prices of different goods, whereas the GDP deflator assigns changing weights. In other words, the CPI is computed using a fixed basket of goods, whereas the GDP deflator allows the basket of goods to change over time as the composition of GDP changes.
|
GDP Deflator |
CPI |
|
1. Measures the prices of all goods and services. |
1. Measures the prices of goods and services bought by the consumers. |
|
2. Includes only domestically produced goods and services |
2. Includes only domestically produced goods and services |
|
3. Assigns Changing weights to the price of different goods. |
3. Assigns fixed weights to the price of different goods. |
|
4. Understates Inflation |
4. Overstates Inflation |
Of the WPI, CPI and Deflator, which is the most reliable measure?
As already mentioned, the deflator is the most accurate indicator of the underlying inflationary tendency, as it covers all goods and services produced in the economy. The other two indices derive from price quotations for select commodity baskets. The WPI basket includes 676 commodities; all of these are only goods and whose prices are captured at the wholesale/producer level. The CPI considers inflation at the retail end, while also including services.
But since only goods and services directly consumed by households from foodstuffs, clothing and petrol to health, education and recreation services — are taken, the CPI does not tell us what is happening to prices of cement, steel, polyester yarn or compressors.
While retail inflation is, no doubt, important, policymakers cannot ignore the prices that producers both of consumer as well as various intermediate and capital goods are receiving. Prolonged negative WPI inflation could, indeed, be indicative of deflationary pressures not being adequately reflected in the CPI. Given all these, the deflator is a better gauge of inflation (or even deflation, as Subramanian is suggesting) in the economy.
So, why is the deflator not much in use?
The main reason is that it is available only on a quarterly basis along with GDP estimates, whereas CPI and WPI data are released every month.
Statistics: Ministry of Statistics and Programme Implementation (MOSPI) comes out with GDP deflator in National Accounts Statistics as price indices. The base of the GDP deflator is revised when base of GDP series is changed.
Why is inflation measured using GDP Deflator generally not considered?
- The basket of goods tracked by the GDP deflator, which is a unit of GDP, is not the same as the typical basket of goods consumed by households (which is dominated by the C component of GDP). The GDP deflator has a very specific purpose, and its name tells you exactly what that purpose is. It should be used to deflate nominal GDP to obtain real GDP. It is not a measure of household inflation, nor is it intended to be, and using to measure the rate of inflation rate faced by households is not appropriate.
- WPI and CPI are available on monthly basis whereas deflator comes with a lag (yearly or quarterly, after quarterly GDP data is released). Hence, monthly change in inflation cannot be tracked using GDP deflator, limiting its usefulness. ‘‘
- The GDP Deflator includes only domestic goods and not anything that is imported. This is different because the CPI includes anything bought by consumers including foreign goods.
Retail Inflation: When inflation is only on the front end, that is, there is no increase in the price index on wholesale level but prices have increased for the final consumer, it signifies retail inflation. Retail inflation can be measured by Consumer Price Index (CPI).
Skewflation: It is a state in which the economy shows the characteristics of both inflation and deflation. For example, some commodities exhibits inflation trend while other commodities show that of deflation during a same period. When this occurs, we can neither term it inflation nor deflation, hence the term skewflation.
Headline Inflation:
Core inflation: Core inflation is the price change of goods and services minus food and energy. It represents the most accurate picture of underlying inflation trends. Food and energy products are too volatile to be included. It excludes transitory or temporary price volatility It reflects the inflation trend in an economy.
Suggested Reading: Should RBI target Headline Inflation or Core Inflation
Producer Price Index(PPI):
The Producer Price Index (PPI) is a weighted index of prices measured at the wholesale, or producer level. The PPI shows trends within the wholesale, manufacturing industries and commodities markets. All of the physical goods-producing industries that make up the economy are included, but imports are not.
The PPI measures the average changes over time in the selling prices received by domestic producers. The PPI differs from the Consumer Price Index (CPI) in terms of the composition of the goods and services covered, the types of prices collected and the extent of coverage of the services sector.
The PPI measures sales at all levels of output for producers. This includes sales of non-finished goods used along the chain of production and output. The CPI measures purchases of finished goods and services by urban households.
There are three stages of the PPI:
- Commodity Index tracks the average price change from the prior month for coal, crude oil and other commodities.
- Stage of processing index measures the prices paid for goods that are sold to manufacturers who will add value and use the goods to produce finished products.
- Industry stage measures the final stage of manufacturing output.
Why the Producer Price Index is important?
The PPI can serve as a leading indicator of ultimate price changes at the consumer level, and of inflation if the trend in the PPI is higher. Low inflation is good for stimulating consumer spending, corporate profits and ultimately the stock market. Increased inflation can be a sign of an overheating economy and potentially higher interest rates.
The PPI can provide analysts, business executives and investors with information about the trends in prices at various stages of the production process. This is helpful for businesses in making capital investment decisions, for analysts in tracking economic trends and for investors looking for clues as to future inflation.
Strengths of the Producer Price Index:
- Most accurate indicator of future CPI
- Long “operating history” of data series
- Good breakdowns for investors in the companies surveyed (mining, commodity info, some services sectors)
- Can move the markets positively
- Data is presented with and without seasonal adjustment
Weaknesses of the Producer Price Index:
- Volatile elements, such as energy and food, can skew the data.
- Not all industries in the economy are covered.
Index of Industrial Production (IIP)
Index of Industrial Production (IIP) measures the quantum of changes in the industrial production in an economy and captures the general level of industrial activity in the country.
It is a composite indicator expressed in terms of an index number which measures the short term changes in the volume of production of a basket of industrial products during a given period with respect to the base period.
The base year is always given a value of 100. The current base year for the IIP series in India is 2011-12. So, if the current IIP reads as 116 it means that there has been 16% growth compared to the base year.
IIP is a short term indicator of industrial growth till the results from Annual Survey of Industries and National Accounts Statistics are available. However, IIP is considered to be one of the lead indicators for short-term economic analysis because of its strong relationship with economic fluctuations in the rest of economy. Most of services, like transport, storage, communication, real estate, insurance and banking are industry dependent and are considerably influenced by industrial performance.
Index of Industrial Production is compiled and published every month by Central Statistics Office (CSO) of the Ministry of Statistics and Programme Implementation with a time lag of six weeks from the reference month.
In India, the index is compiled using figures of mining, manufacturing and electricity sectors only.
In India IIP uses base year weights, which remain fixed through the entire period of the series and uses a combination of volumes and deflators in its compilation.
While the usual preference is for volumes (like numbers, tonnes), deflators (a measure of price which when used as a denominator to divide the value of production, gives a volume based measure as result) are used for items/sectors which are not normally amenable to a volume based measure.
The number of such items in the new 2011-12 series for which data will be captured in value terms will be 109 (instead of 54 in the 2004-05 series). The commodity specific Wholesale Price Index is used as deflators.
Revision of IIP to 2011-12 base year (from 2003-04)
The Central Statistics Office (CSO) revised the base year of the all-India Index of Industrial Production (IIP) from 2004-05 to 2011-12 on 12 May 2017.Revisions in the IIP are necessitated to maintain representativeness of the items and producing entities and also address issues relating to continuous flow of production data.
The base year revision captures structural changes in the economy and improves the quality and representativeness of the indices. The revised IIP (2011-12) not only reflect the changes in the industrial sector but also aligns it with the base year of other macroeconomic indicators like the Gross Domestic Product (GDP) and Wholesale Price Index (WPI).
Purchasing Manager’s Index (PMI)
Purchasing Managers’ Index (PMI) is an indicator of business activity — both in the manufacturing and services sectors. It is a survey-based measures that asks the respondents about changes in their perception of some key business variables from the month before. It is calculated separately for the manufacturing and services sectors and then a composite index is constructed.
How is the PMI derived?
The PMI is derived from a series of qualitative questions. Executives from a reasonably big sample, running into hundreds of firms, are asked whether key indicators such as output, new orders, business expectations and employment were stronger than the month before and are asked to rate them.
How does one read the PMI?
A figure above 50 denotes expansion in business activity. Anything below 50 denotes contraction. Higher the difference from this mid-point greater the expansion or contraction. The rate of expansion can also be judged by comparing the PMI with that of the previous month data. If the figure is higher than the previous month’s then the economy is expanding at a faster rate. If it is lower than the previous month then it is growing at a lower rate.
Before going into the details of PMI like its components, origin of the index is to be understood. The Institute of Supply Management (ISM) originally developed PMI and is now estimating it for the US economy. The ISM is a non-profit group having more than 40,000 members from the supply management and purchasing segments. Strength of the ISM’s PMI is its large number of data quote.
ISM’s PMI index was based on five major indicators: new orders, inventory levels, production, supplier deliveries and the employment environment. All these indicators strategically are capable of showing the business momentum in the industrial sector of an economy.
How PMI is different from IIP
The popular index that measures growth in the industrial sector as far as India is concerned is the CSO prepared Index of Industrial Production. IIP shows the change in production volume in major industrial subsectors like manufacturing, mining and electricity. Similarly, the IIP also gives use based (capital goods, consumer goods etc) trends in industrial production. It covers broader industrial sector compared to PMI.
But compared volume based production indicator like the IIP, the PMI senses dynamic trends because of the variable it uses for the construction of the index.
For example, new orders under PMI show growth oriented positive trends and not just volume of past production that can be traced in an ordinary Index of Industrial Production. Inventory level shows recessionary or boom trends. Employment scenario is also sentimental indicator. Hence, the PMI is more dynamic compared to a standard industrial production index.
PMI for India
For India, the PMI Data is published by Japanese firm Nikkei but compiled and constructed by Markit Economics (for the US, it is the ISM). A manufacturing PMI and services PMI are prepared and published by the two. The Nikkei and market economics websites says that PMI data are based on monthly surveys of carefully selected companies.
Variables used in constructing the PMI for the Manufacturing sector
The variables used to construct India’s PMI are: Output, New Orders, Employment, Input Costs, Output Prices, Backlogs of Work, Export Orders, Quantity of Purchases, Suppliers& Delivery Times, Stocks of Purchases and Stocks of Finished Goods. Similar variables (but less in number) are used for the construction of services PMI.
The PMI is very closely watched, as it shows the investor sentiment in an economy’s manufacturing sector. In terms of composition, we can say the PMI is a sentiment tracking index. On the other hand, the Index of Industrial Production indicates changes in production volume or output.
What are its implications for the economy?
The PMI is usually released at the start of the month, much before most of the official data on industrial output, manufacturing and GDP growth becomes available. It is, therefore, considered a good leading indicator of economic activity.
Economists consider the manufacturing growth measured by the PMI as a good indicator of industrial output, for which official statistics are released later. Central banks of many countries also use the index to help make decisions on interest rates.
What does it mean for financial markets?
The PMI also gives an indication of corporate earnings and is closely watched by investors as well as the bond markets. A good reading enhances the attractiveness of an economy vis-a- vis another competing economy.
Base Effect
Base effect measures relative change in inflation corresponding to an earlier period. Base effect is often a term used in relation to economic indicators such as inflation and IIP data which are primarily based on the base effect of last year. To better understand this best effect it will be best to explain it using an illustration-Inflation is calculated in reference to a base year.
Let’s assume that if the price index was 100 in 2016, if it rise by 110 in 2017 then the inflation level rose by 10% and if it rise by 115 in 2018 than it is almost 5% with respect to 2017 and 15% with respect to 2016. So the percentage of inflation looks relatively small when compared to 2017 and 2018 than comparing with 2016 and 2018 which provides an accurate picture. This is called base effect.
Q) A rapid increase in the rate of inflation is sometimes attributed to the “base effect”. What is “base effect”?
(a) It is the impact of drastic deficiency in supply due to failure of crops
(b) It is the impact of the surge in demand due to rapid economic growth
(c) It is the impact of the price levels of previous year on the calculation of inflation rate
(d) None of the statements (a), (b) and (c) given above is correct in this context
Base year for measuring Inflation
In India, generally, two kinds of indices are used to measure inflation—Wholesale Price Index (WPI) and Consumer Price Index (CPI). The base years foe WPI and CPI are as follows.
|
Index |
Agency |
Base Year |
Number of Commodities |
|
WPI |
Office of Economic Affairs, Ministry of Commerce and Industries |
2011-12 |
697 |
|
CPI All India, CPI -Urban and Rural |
CSO, Ministry of Statistics and Programme Implementation |
2011-12 |
448 (rural) |
|
CPI-AL |
Labour Bureau, Ministry of Labour and Employment |
1986-87 |
460 (urban) |
|
CPI-RL |
1986-87 |
||
|
CPI-IW |
2001 |
Monetary Policy Framework Agreement:
The Reserve Bank of India signed a Monetary Policy Framework Agreement with the Central government with the primary goal of price stabilisation keeping in mind the objective of growth.
What is Monetary Policy Framework Agreement?
- It is an agreement between the RBI and central government setting quantifiable targets for the monetary policy.
- The Reserve Bank of India and the Government of India signed a Monetary Policy Framework Agreement in 2015.
- Following the proposals of a group led by RBI Deputy Governor Urjit Patel, the new monetary policy framework was created.
- The primary goal of the monetary policy framework is to maintain price stability while still pursuing the goal of growth.
Provisions of Monetary Policy Framework Agreement (MPFA)
- According to the agreement, the RBI will set policy interest rates with the goal of bringing inflation below 6% by January 2016, and within
4% +/- 2% band for 2016-17 and all subsequent years.
- The Governor of RBI (in his absence the Deputy Governor) is in charge of the monetary policy and will determine policy rates for inflation targeting.
- Every 6 months RBI publishes a report stating
- Sources of inflation
- Forecast of inflation for the next 6 to 18 months
- If consumer inflation is more than 6% or less than 2% for three consecutive quarters beginning in the 2015-16 fiscal year, the central bank will be considered to have missed its objective.
- If the central bank fails to meet its inflation target then:
- it will send a report to the government explaining why and what steps it will take to correct the problem.
- It will also have to provide an estimate of how long it will take to return to the target level.
- Any dispute regarding implementation and interpretation will be resolved by a meeting between Governor and central government.
- Section 45ZB of the revised RBI Act of 1934 authorises the Central Government to establish a six-member monetary policy committee (MPC). As a result, the Central Government established the MPC in September 2016.
Note:
- The initial Monetary Policy Framework was set for 5 years which ended in 2021.
- The government set the same target of 4% for inflation between 2021-2026 by extending it by another 5 years.
Significance of Monetary Policy Framework Agreement
- While the agreement offers the RBI Governor broad discretion in deciding on monetary policy measures to meet the inflation objective, it also compels the RBI to submit a report to the Central Government if the target is missed for an extended period of time.
- As a result, it is a fragile balance between autonomy and accountability.
- Central banks all across the world are moving toward inflation targeting as a monetary policy management criterion. The MPFA represents a step in the right direction.
- The MPFA will admit India to the League of Nations, which has a monetary policy based on rules.
Philips Curve:
The Phillips Curve is an economic concept that depicts an inverse relationship between the rate of unemployment and the rate of inflation in an economy. It suggests that with lower unemployment, inflation tends to be higher, and vice versa.
The curve suggests that as unemployment decreases, businesses raise wages to attract scarce labor, leading to increased consumer spending and higher prices, resulting in inflation. Conversely, higher unemployment leads to lower wage pressure and reduced inflation.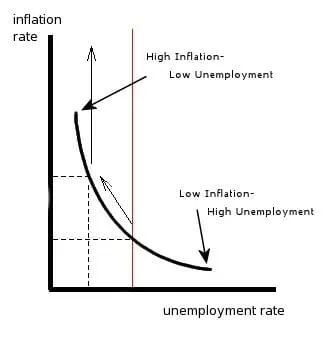 Non Accelerating Inflation Rate of Unemployment(NAIRU)
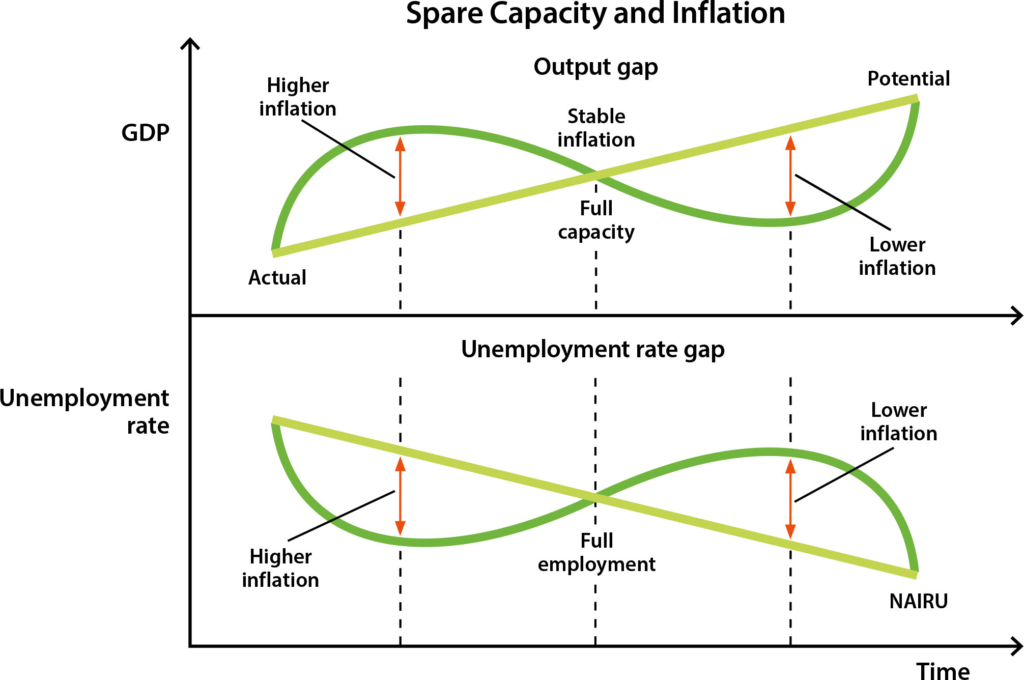
- The non-accelerating inflation rate of unemployment (NAIRU) is the lowest level of unemployment that can occur in the economy before inflation starts to inch higher.
- When unemployment is at the NAIRU level, inflation is steady; when unemployment rises, inflation decreases; when unemployment drops, inflation increases.
Typically as unemployment rises, inflation should decrease. If the economy is performing poorly, inflation tends to fall or subside since businesses can’t increase prices due to the lack of consumer demand. If demand for a product decreases, the price of the product falls as fewer consumers want the product, resulting in a cut in prices by the business to stimulate demand or buying interest in the product. NAIRU is the level of unemployment that the economy has to rise to before prices begin falling.
Mains Previous Questions:
- What are the causes of persistent high food inflation in India? Comment on the effectiveness of the monetary policy of the RBI to control this type of inflation.(2024)
Reference: Should RBI target Headline Inflation or Core Inflation - Do you agree with the view that steady GDP growth and low inflation have left the Indian economy in good shape? Give reasons in support of your arguments.(2019)

