Measures of Development

  • Growth Vs Development
  • Economic Growth Vs Economic Development
  • Exclusive and Inclusive growth
  • Measures/ Indexes of Development
    • Human Development Index
    • Gross National Happiness Index
    • Gender Inequality Index
    • Gender Development Index
    • Human Poverty Index (HPI)
    • Multidimensional Poverty Index
    • Physical Quality of Life Index
    • Social Progress Index
    • Genuine Progress Indicator
Growth Vs Development
  • The term Growth and Development are near synonymous but not the same thing. Both growth and development refer to changes over a time period. Both express the idea of increase, but growth means an increase in quantity, while development is about quality.
  • Growth can be both positive and negative like GDP whereas development is always positive as it shows quality improvement like Education, Basic amenities, Infrastructure, Manufacturing etc.,
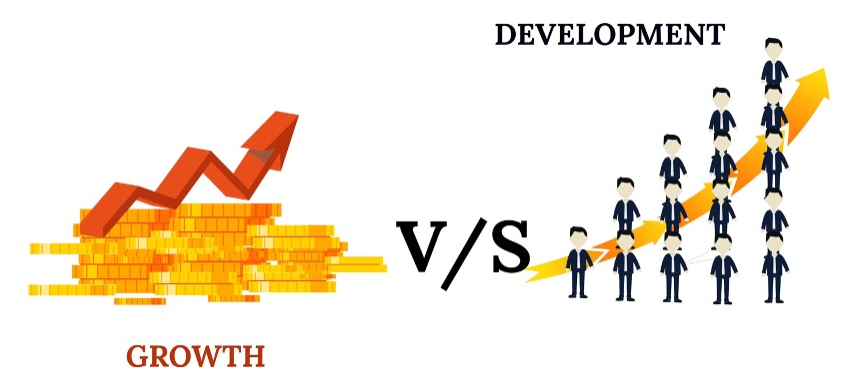
  • Development is basically a positive growth in addition to quality.
  • As we understood the difference between growth and development. Let’s try to understand Economic Growth and Economic Development.
Economic Growth Vs Economic Development
Economic Growth

Economic Growth is defined as the rise in the money value of goods and services produced by all the sectors of the economy per head during a particular period. It is a quantitative measure that shows the increase in the number of commercial transactions in an economy.
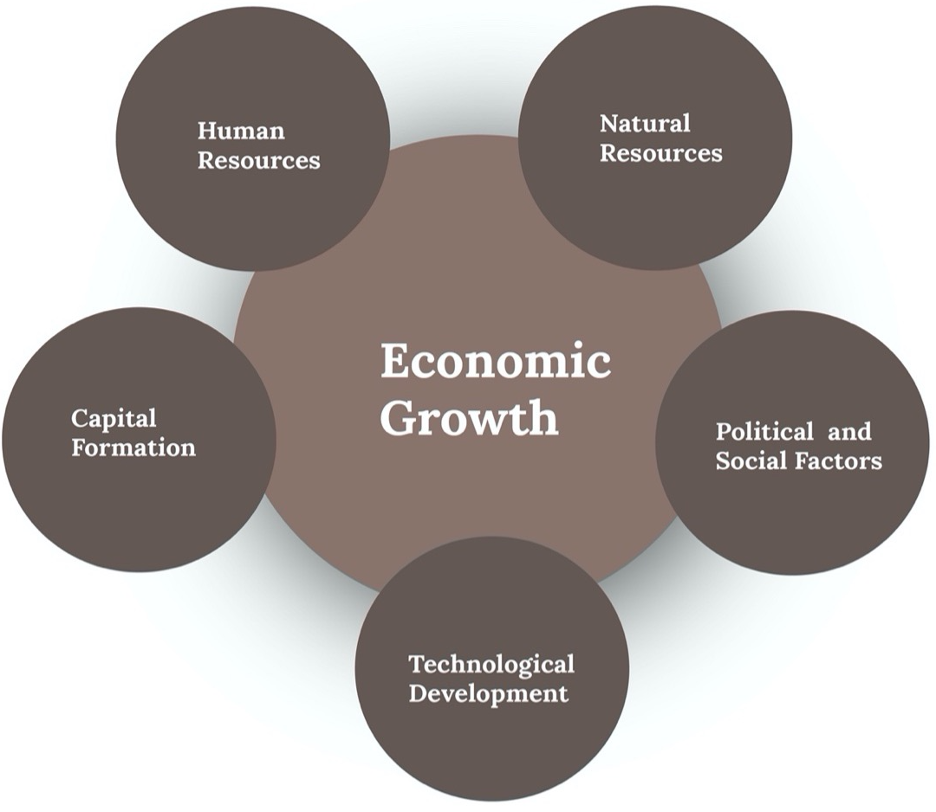
Determinants of Economic Growth:
Economic growth can be expressed in terms of gross domestic product (GDP) and gross national product (GNP), that helps in measuring the size of the economy. It lets us compare in absolute and percentage change, i.e. how much an economy has progressed since last year. It is an outcome of the increase in the quality and quantity of resources and advancement of technology.

Economic Development
  • Economic Development is defined as the process of increase volume of production along with the improvement in technology, a rise in the level of living, institutional changes, etc. In short, it is the progress in the socio-economic structure of the economy.
  • Human Development Index (HDI) is the appropriate tool to gauge the development in the economy. Based on the development, the HDI statistics rank countries. It considers the overall development in an economy regarding the standard of living, GDP, living conditions, technological advancement, improvement in self-esteem needs, the creation of opportunities, per capita income, infrastructural and industrial development and much more.
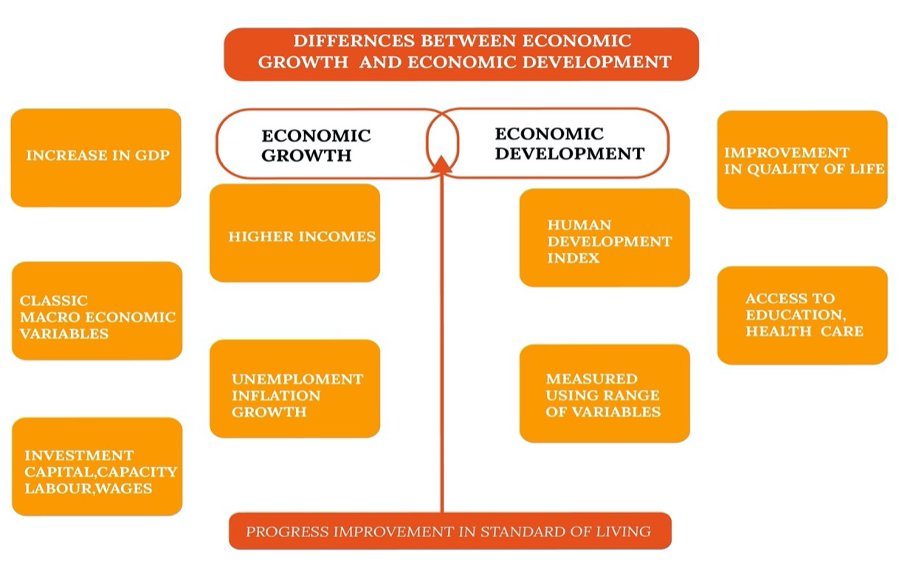
Difference between Economic Growth and Economic Development
The fundamental differences between economic growth and development are explained in the points given below:

  1. Economic growth is the positive change in the real output of the country in a particular span of time economy. Economic Development involves a rise in the level of production in an economy along with the advancement of technology, improvement in living standards and so on.
  2. Economic growth is one of the features of economic development.
  3. Economic growth is an automatic process. Unlike economic development, which is the outcome of planned and result-oriented activities.
  4. Economic growth enables an increase in the indicators like GDP, per capita income, etc. On the other hand, economic development enables improvement in the life expectancy rate, infant mortality rate, literacy rate and poverty rates.
  5. Economic growth can be measured when there is a positive change in the national income, whereas economic development can be seen when there is an increase in real national income.
  6. Economic growth is a short-term process which takes into account yearly growth of the economy. But if we talk about economic development it is a long term process.
  7. Economic Growth applies to developed economies to gauge the quality of life, but as it is an essential condition for the development, it applies to developing countries also. In contrast to, economic development applies to developing countries to measure progress.
  8. Economic Growth results in quantitative changes, but economic development brings both quantitative and qualitative changes.
  9. Economic growth can be measured in a particular period. As opposed to economic development is a continuous process so that it can be seen in the long run.

Let’s try to understand the two terms economic growth and economic development, we will take an example of a human being.

  • The term growth of human beings simply means the increase in their height and weight which is purely physical. But if you talk about human development, it will take into account both the physical and abstract aspects like maturity level, attitudes, habits, behaviour, feelings, intelligence and so on.
  • In the same manner, growth of an economy can be measured through the increase in its size in the current year in comparison to previous years, but economic development includes not only physical but also non-physical aspects that can only be experienced like improvement in the lifestyle of the inhabitants, increase in individual income, improvement in technology and infrastructure, etc.
Exclusive and Inclusive growth
Exclusive growth
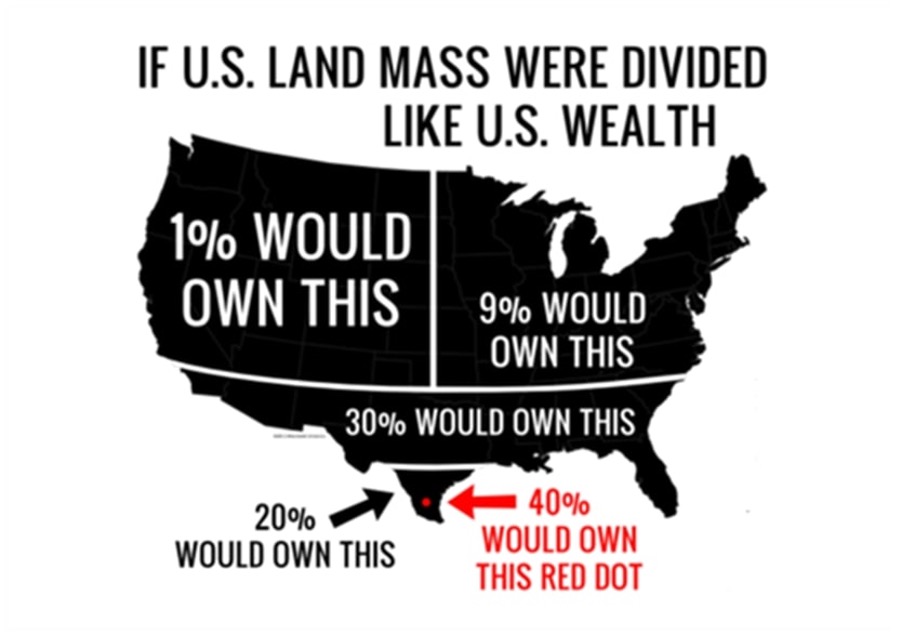
  • Exclusive growth is one where the fruits or benefits of growth are not equitably shared among the people of a country.
  • It could also lead to a condition of jobless growth that was seen in India during the past decade.
  • It could lead to a scenario of the rich getting richer and the poor, poorer.
  • Very few people will be sharing a very large part of the countries resources and there would be no egalitarianism.
  • Exclusive growth leads to poverty, unemployment, regional disparities, Income disparities, etc.,
  • Let’s understand this with an example – The richest 1% in the United States now own more wealth than the bottom 90 %. Wealth includes the values of homes, automobiles, personal valuables, businesses, savings, and investments.
Inclusive growth:
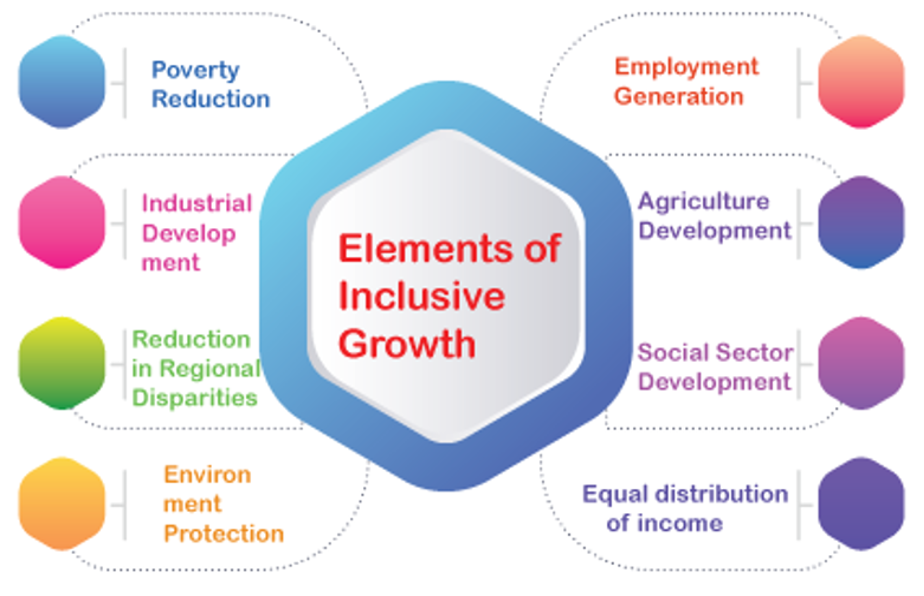
  • Inclusive growth is defined as “the process and the outcome where all groups of people have participated in growth and have benefited equitably from it”. This implies that inclusive growth should include all sections as beneficiaries as well as partners in growth and that inclusion of the excluded should be embodied in the growth process.
  • Inclusive growth is the growth that reduces disparities among per capita incomes in agriculture and non-agriculture, in rural and urban areas, and in different socio-economic groups, particularly between men and women and among different ethnic groups.
  • The result of inclusive growth is reduction in vertical inequalities (individual inequalities) and horizontal inequalities (group inequalities).
  • Inclusive growth means economic growth that creates employment opportunities and helps in reducing poverty. It means having access to essential services in health and education by the poor. It includes providing equality of opportunity, empowering people through education and skill development.
  • It also encompasses a growth process that is environment-friendly growth, aims for good governance and helps in creation of a gender-sensitive society.

Let’s understand Inclusiveness with an example –
In a cricket team, the most acceptable player is the one who has a good control over his batting, bowling and fielding making him an all-rounder. So, when it comes to an all-rounder economy it is accepted as an effective growth which includes all the aspects of development and progress as its priority i.e., not only economic aspects but also social-justice and welfare aspects too.

  • This sort of growth is considered as inclusive growth where what is produced or how much is produced is kept in parallel with for whom it has been produced, and most importantly how many are being benefited with such production.
  • The basis to attain such growth is broad which involves economic, social, political and geographical aspects being as base for any developing country.
Now that we have understood what growth and development and its various facets are, let’s look at some measures of development.

Measures of Development
Human Development Index
  • The Human Development Index (HDI) is a statistical tool used to measure a country’s overall achievement in its social and economic dimensions. The social and economic dimensions of a country are based on the health of people, their level of educational attainment and their standard of living.
  • Pakistani economist Mahbub-ul-Haq created HDI in 1990 which was further used to measure the country’s development by the United Nations Development Program (UNDP).

Calculation of the index combines four major indicators:

  1. Life expectancy for health,
  2. Expected years of schooling,
  3. Mean of years of schooling for education and
  4. Gross National Income per capita for the standard of living.

 Why do we require HDI?

  • Firstly, GDP method of calculating progress ignores non-income aspects like education and health thus, for example, Arab countries have high GDP per-capita, but the progress in health and education field is limited in those countries which do not get measured in GDP. Similarly, in countries like Cuba and Sri Lanka GDP per capita is low, but the quality of life is much better than many high GDP per capita countries of the Arab world and Latin America because of high-quality indicators in social sectors. HDI will overcome this problem
  • Secondly, GDP per capita ignores income inequality or distribution of wealth in a country for example in countries of Latin America have high GDP per capita but due to skewed income distribution, the masses are excluded from growth process.
  • The HDI was created to emphasize that people and their capabilities should be the ultimate criteria for assessing the development of a country, not economic growth alone

Method of calculating HDI

  • The Human Development Index (HDI) is a summary measure of average achievement in key dimensions of human development: a long and healthy life, being knowledgeable and have a decent standard of living.
  • The HDI is the geometric mean of normalized indices for each of the three dimensions.
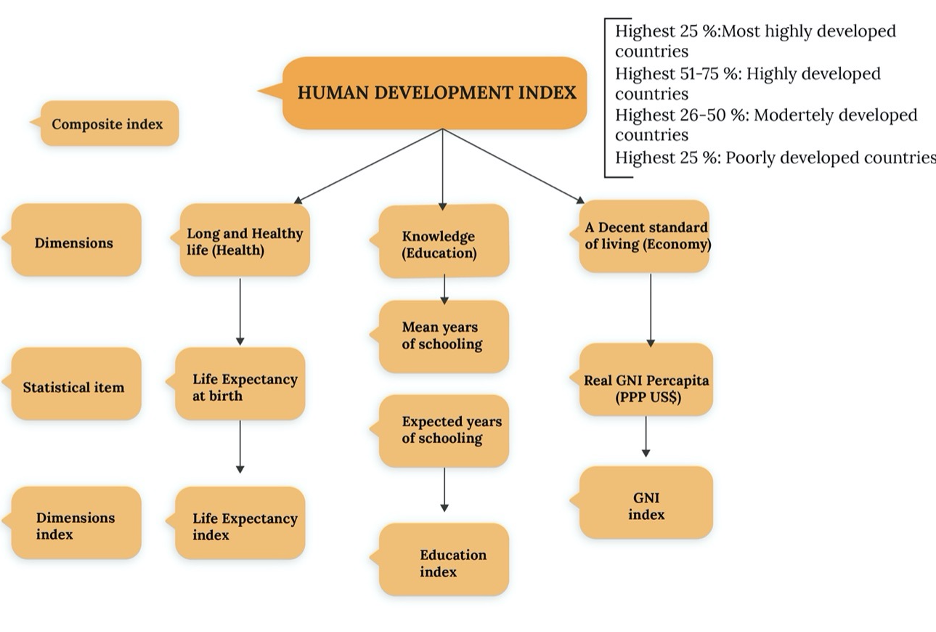
(a) Life Expectancy Index assessment

The minimum value for life expectancy is fixed at 20 years in the new calculation. The maximum value for life index is kept at 83.2 years.

(b) Education Index assessment

Education Index (EI) assessment is composite of two indices. They are

  1. Mean Years of Schooling Index (MYSI)
  2. Expected Years of Schooling Index (EYSI)

(c) Income Index assessment

  • To calculate this index, goal posts are set as per observations during 1980 – 2010 in various countries. Gross National Income per capita is taken as a measure to calculate new Income Index in new HDI. Minimum income is set as $163, and maximum income is set as $108,211.

 How to calculate Human Development Index as per new method?

  • Formula to calculate Human Development Index (HDI) = (Life Expectancy Index x Education Index x Income Index) 1/3
  • New Human Development Index (HDI) is geometric mean of Life Expectancy Index (LEI), Education Index (EI) and Income Index (II).
  • After this calculation total value will be between 0 and 1. As per the values gained, countries will be placed in the list of the division of countries. They are divided into very high human development, high human development, medium high human development and low high human development countries

Inequality-adjusted Human Development Index

  • The 2010 HDR introduced the Inequality-Adjusted HDI (IHDI), which takes into account inequality in all three dimensions of the HDI by ‘discounting’ each dimension’s average value according to its level of inequality.
  • The IHDI is basically the HDI discounted for inequalities. The ‘loss’ in human development due to inequality is given by the difference between the HDI and the IHDI, and can be expressed as a percentage.
  • As the inequality in a country increases, the loss in human development also increases.
  • The IHDI takes into account not only the average achievements of a country on health, education and income, but also how those achievements are distributed among its population by “discounting” each dimension’s average value according to its level of inequality.
  • While the HDI can be viewed as an index of average achievements in human development dimensions, the IHDI measures the level of human development when the distribution of achievements across people in the society is accounted for.
  • The IHDI will be equal to the HDI when there is no inequality, but falls below the HDI as inequality rises. The difference between the HDI and IHDI, expressed as a percentage of the HDI, indicates the loss in human development due to inequality.
  • The IHDI captures the inequality in distribution of the HDI dimensions.
  • However, it is not association sensitive, meaning that it does not account for overlapping inequalities—whether the same people are at the lower end of each distribution.
  • Also, individual values of education and income can be zero or even negative (for income), so they have been adjusted to non-negative non-zero values uniformly across countries.
Gross National Happiness Index
  • Gross National Happiness is a term coined by his Majesty the fourth King of Bhutan, Jigme Singye Wangchuck in the 1970s. The concept implies that sustainable development should take a holistic approach towards notions of progress and give equal importance to non-economic aspects of well-being.
  • “How are you?” We ask that question of one another often. But how are we doing – as a country, a society? To answer that question, Bhutan uses its Gross National Happiness (GNH) Index.
  • GNH is a much richer objective than GDP or economic growth. In GNH, material well-being is important, but it is also important to enjoy sufficient well-being in things like community, culture, governance, knowledge and wisdom, health, spirituality and psychological welfare, a balanced use of time, and harmony with the environment.

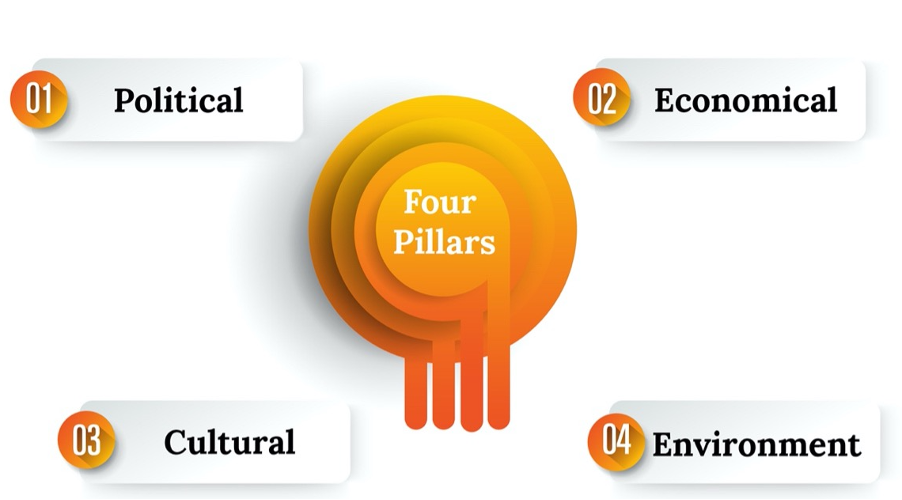
The concept of GNH has often been explained by its four pillars:

  1. Good governance,
  2. Sustainable Socio-Economic Development,
  3. Cultural Preservation, and
  4. Environmental Conservation

​​​​​​​Lately the four pillars have been further classified into nine domains in order to create widespread understanding of GNH and to reflect the holistic range of GNH values.
The nine domains are:

  1. Psychological well-being,
  2. Health,
  3. Education,
  4. Time use,
  5. Cultural diversity and resilience,
  6. Good governance,
  7. Community vitality,
  8. Ecological diversity and resilience, and
  9. Living standards.
  • The domains represents each of the components of well-being of the Bhutanese people, and the term ‘well-being’ here refers to fulfilling conditions of a ‘good life’ as per the values and principles laid down by the concept of Gross National Happiness.
  • The Gross National Happiness Index is a single number index developed from 33 indicators categorized under nine domains.
  • The GNH Index is constructed based upon a robust multidimensional methodology known as the Alkire-Foster method.
Gender Inequality Index
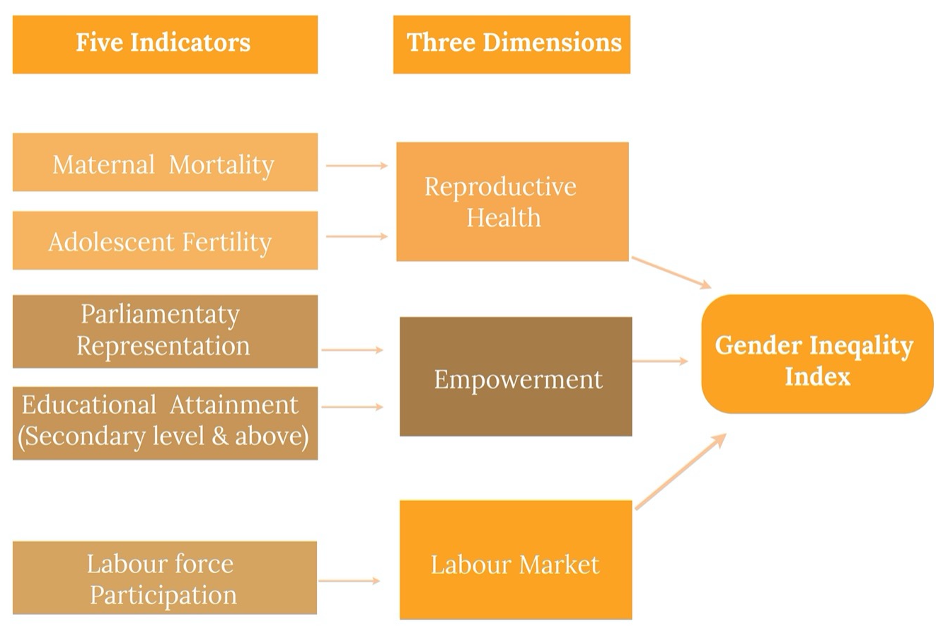
  • The Gender Inequality Index (GII) is an inequality index. It shows the loss in potential human development due to disparity between female and male achievements in two dimensions, empowerment and economic status, and reflects a country’s position relative to normative ideals for the key dimension of women’s health. Overall, the GII reflects how women are disadvantaged in these dimensions.
  • There is no country with perfect gender equality – hence all countries suffer some loss in achievements in key aspects of human development when gender inequality is taken into account.
  • The GII is similar in method to the Inequality-adjusted Human Development Index (IHDI). It can be interpreted as a combined loss to achievements in reproductive health, empowerment and labour market participation due to gender inequalities.
  • Since the GII includes different dimensions than the HDI, it cannot be interpreted as a loss in HDI itself. The GII ranges between 0 and 1 and higher GII values indicate higher levels of inequalities.
  • The GII includes reproductive health and goes beyond the literacy and primary education. It also reveals gender disparities in labour market participation, instead of using the flawed sex-disaggregated income measure.
  • Like all composite measures, the GII has some limitations.
  • First, it does not capture the length and breadth of gender inequality. For example, the use of national parliamentary representation excludes participation at the local government level and elsewhere in community and public life.
  • The labour market dimension lacks information on employment, having an adequate job, and unpaid work that is mostly done by women.
  • The index misses other important dimensions, such as time use – the fact that many women have the additional burden of care giving and housekeeping cuts into their leisure time and increases stress and physical exhaustion.
  • Asset ownership, child care support, gender-based violence and participation in community decision-making are also not captured in the GII, mainly due to limited data availability.
Gender Development Index
  • In the 2014 HDR, a new measure was introduced, the Gender Development Index (GDI) based on the sex-disaggregated Human Development Index, defined as a ratio of the female to the male HDI.
  • The GDI measures differences between male and female achievements in three basic dimensions of human development health, measured by female and male life expectancy at birth; education measured by female and male expected years of schooling for children and female and male mean years of schooling for adults ages 25 and older, and equitable command over economic resources measured by female and male estimated earned income.
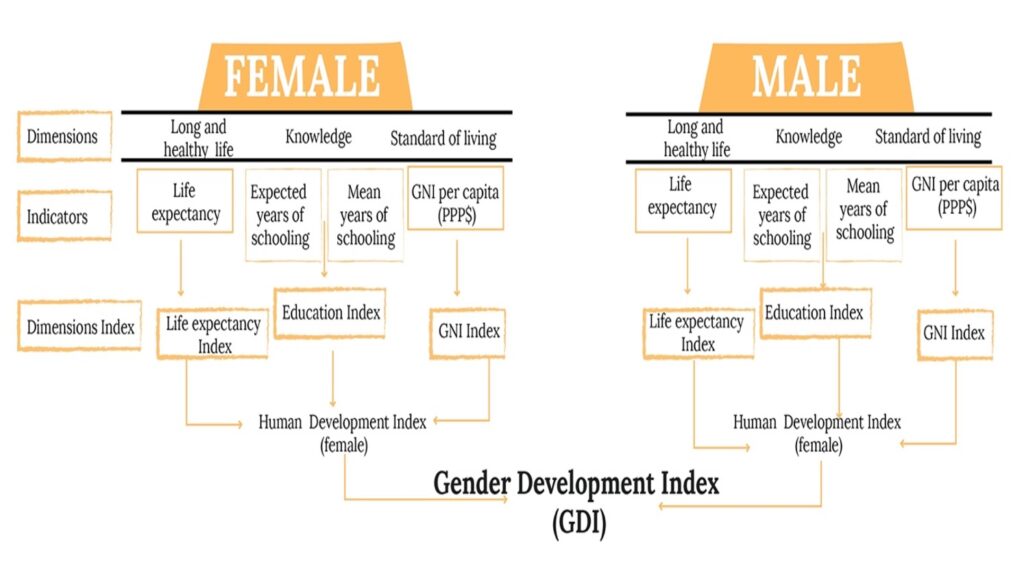
  • To calculate the GDI, the HDI is calculated separately for females and for males using the same methodology as in the HDI. The same goalposts as in the HDI are used for transforming the indicators into a scale between zero and one. The only exception is life expectancy at birth where calculations are adjusted for the average of five years biological advantage that women have over men.
  • The GDI provides insights into gender disparities in achievements in three basic capabilities: health, education and command over economic resources.
  • It helps further understanding of the real gender gap in human development achievements and is useful for navigating policies to close the gap.
Human Poverty Index (HPI)
  • The Human Poverty Index (HPI) devised by United Nations (UN) which gave an indication of the standard of living in a country. It complemented the Human Development Index (HDI) and was first reported as part of the Human Development Report in 1997.
  • Traditionally poverty has been measured as lack of income—but this is far too narrow a definition. Human poverty is a thought that catches the numerous dimensions of poverty that exist in both poor and rich nations – it is the refusal of decisions and chances for carrying on with a life one has motivation to esteem.
  • The HPI-1—human poverty index for developing countries—measures human deprivations in the same three aspects of human development as the HDI (longevity, knowledge and a decent standard of living).

For HPI – 1 (Developing Countries): deprivations in life span are measured by the probability at birth of not surviving due to age 40; deprivations in information are measured by the rate of grown – ups who are illiterate; deprivations in a respectable expectation for everyday comforts measured by two variables.

HPI-2— human poverty index for selected high-income OECD countries— includes, in addition to the three dimensions in HPI-1, social exclusion.

For HPI-2 (selected high-income OECD countries): deprivations in life span are measured by the probability at birth of not achieving age of 60; deprivations in information are measured by the rate of mature people needing practical proficiency aptitudes; deprivations in an average expectation for everyday comforts are measured by the rate of individuals living underneath the income poverty line, set at half of the balanced average family disposable salary; and social rejection is measured by the rate of long haul (12 months or more) unemployment of the work power.

How is the HPI used?

  • To guide national planning for poverty alleviation. Many National Human Development Reports now break down the HPI by region or other socioeconomic groups to identify the areas or social groups within the country most deprived in terms of human poverty. The results can be dramatic, creating national debate and helping in reframing and reshaping of policies.
  • To focus attention on the most deprived people and deprivations in basic human capabilities in a country, not on average national achievement. The HPI focuses directly on the number of people living in poverty—presenting a very different picture from average national achievement. It also moves the focus of poverty debates on other concerns also and not poverty alone.
  • To shed light on the presence of human poverty in both the rich/poor or developed/undeveloped countries. High per capita income is no guarantee of a poverty-free country. Even in the richest countries, there is human poverty. The HPI-2 for selected high-income OECD countries (HPI-2) reveals that out of 17 European and North American countries, the U.S. has the 2nd highest per capita income , but also the highest rate of human poverty.
Multidimensional Poverty Index (MPI)
  • The Global Multidimensional Poverty Index (MPI) was developed in 2010 by the Oxford Poverty & Human Development Initiative (OPHI) and the United Nations Development Programme and uses different factors to determine poverty beyond income-based lists.
  • It replaced the previous Human Poverty Index. The global MPI is released annually by OPHI.
  • The global Multidimensional Poverty Index (MPI) is an international measure of acute poverty covering over 100 developing countries. It complements traditional income-based poverty measures by capturing the severe deprivations that each person faces at the same time with respect to education, health and living standards.
  • The MPI assesses poverty at the individual level. If someone is deprived in a third or more of ten (weighted) indicators, the global index identifies them as ‘MPI poor’, and the extent – or intensity – of their poverty is measured by the number of deprivations they are experiencing.
  • If the household deprivation score is 33.3 percent or greater, the household (and everyone in it) is classed as multi-dimensionally poor. Households with a deprivation score greater than or equal to 20 percent but less than 33.3 percent are near multidimensional poverty.
  • The MPI can be used to create a comprehensive picture of people living in poverty, and permits comparisons both across countries, regions and the world and within countries by ethnic group, urban/rural location, as well Each dimension and each indicator within a dimension is equally weighted.

The components of MPI are:
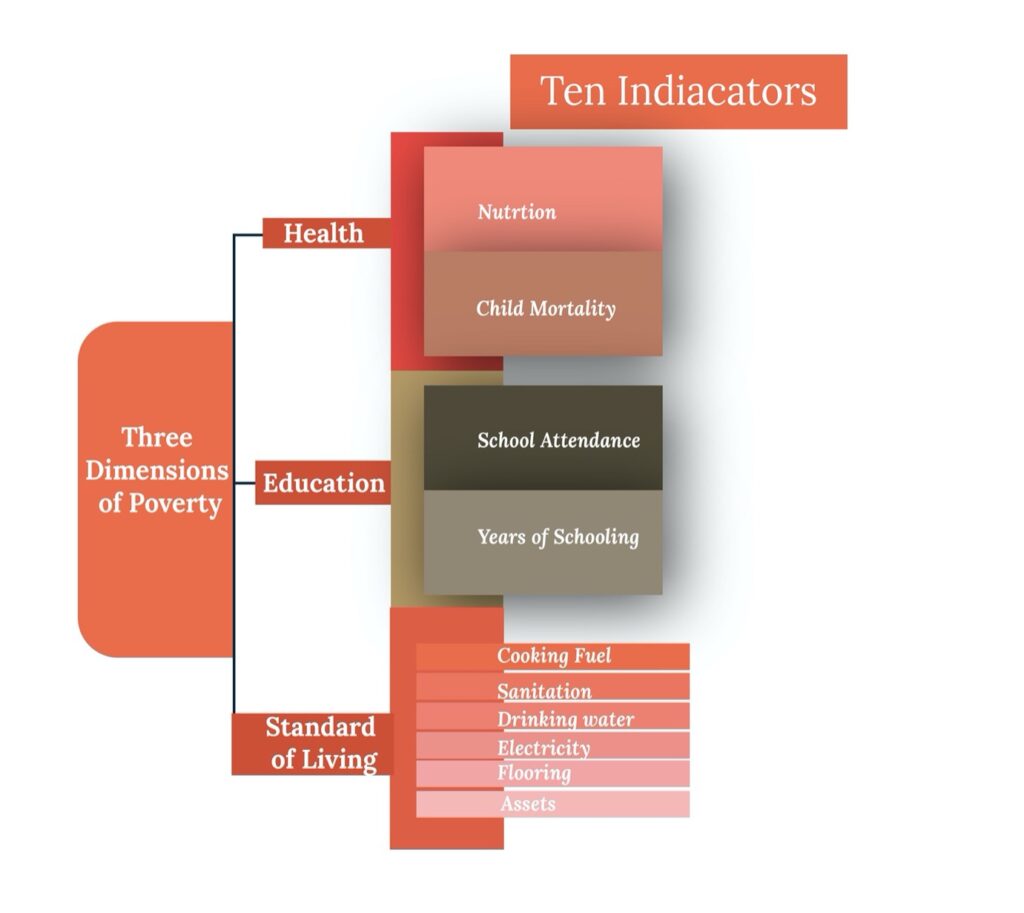
  1. Education (each indicator is weighted equally at 1/6)
  • Years of Schooling: deprived if no household member has completed five years of schooling
  • Child Enrolment: deprived if any school-aged child is not attending school in years 1 to 8
  1. Health (each indicator is weighted equally at 1/6)
  • Child Mortality: deprived if any child has died in the family
  • Nutrition: deprived if any adult or child for whom there is nutritional information is malnourished
  1. Standard of Living (each indicator is weighted equally at 1/18)
  • Electricity: deprived if the household has no electricity
  • Drinking water: deprived if the household does not have access to clean drinking water or clean water is more than 30 minute’s walk from home
  • Sanitation: deprived if they do not have an improved toilet or if their toilet is shared
  • Flooring: deprived if the household has dirt, sand or dung floor
  • Cooking Fuel: deprived if they cook with wood, charcoal or dung
  • Assets: deprived if the household does not own more than one of: radio, TV, telephone, bike, or motorbike, and do not own a car or tractor.

The above characteristic make the MPI useful as an analytical tool to identify the most vulnerable people – the poorest among the poor, revealing poverty patterns within countries and over time, enabling policy makers to target resources and design policies more effectively.

Physical Quality of Life Index (PQLI)
  • The Physical Quality of Life Index (PQLI) is an attempt to measure the quality of life or well-being of a country.
  • The value is the average of three statistics: basic literacy rate, infant mortality, and life expectancy at age one, all equally weighted on a 0 to 100 scale.
  • It was developed for the Overseas Development Council in the mid-1970s by Morris David Morris, as one of a number of measures created due to dissatisfaction with the use of GNP as an indicator of development.

Limitations of PQLI

  • PQLI might be regarded as an improvement, but shares the general problems of measuring quality of life in a quantitative way. It has also been criticized because there is considerable overlap between infant mortality and life expectancy.
  • The UN Human Development Index is a more widely used means of measuring well-being.

 Steps to Calculate Physical Quality of Life:

  1. Find percentage of the population that is literate (literacy rate).
  2. Find the infant mortality rate. (out of 1000 births).

Indexed Infant Mortality Rate = (166 – infant mortality) × 0.625

  1. Find the Life Expectancy.

Indexed Life Expectancy = (Life expectancy – 42) × 2.7

  1. Physical Quality of Life = (Literacy Rate + INDEXED Infant Mortality Rate + INDEXED Life Expectancy) / 3

Usefulness of PQLI

  • The PQLI informs about the changing distribution of social benefits among countries, between the sexes, among ethnic groups, and by region and sector.
  • The PQLI facilitates international and regional comparisons by minimizing developmental and cultural ethnocentricities.
  • As the gap closes between current performance and maximum attainable performance, the gaps between PQLI indices should close.
  • The PQLI, with signs of lowered infant mortality and lengthened life expectancy, paints a less fatalistic pessimistic picture than the GNP.
Social Progress Index (SPI)
  • The Social Progress Index measures the extent to which countries provide for the social and environmental needs of their citizens.
  • Fifty-four indicators in the areas of basic human needs, foundations of well-being, and opportunity to progress show the relative performance of nations.
  • The index is published by the non-profit Social Progress Imperative, and is based on the writings of Amartya Sen, Douglass North, and Joseph Stiglitz.
  • The SPI measures the well-being of a society by observing social and environmental outcomes directly rather than the economic factors.
  • The social and environmental factors include wellness (including health, shelter and sanitation), equality, inclusion, sustainability and personal freedom and safety.
  • The index defines social progress as the capacity of a society to meet the basic human needs of its citizens, establish the building blocks that allow citizens and communities to enhance and sustain the quality of their lives, and create the conditions for all individuals to reach their full potential.

Two key features of the Social Progress Index are:

  1. The exclusion of economic variables
  2. The use of outcome measures rather than inputs

 Usefulness Of SPI

  • The primary goal of the Social Progress Index is to provide a rigorous tool to benchmark progress and stimulate progress within countries.
  • Social progress depends on the policy choices, investments, and implementation capabilities of multiple stakeholders—government, civil society, and business. By informing and motivating those stake holders to work together and develop a more holistic approach to development, social progress will be accelerated.

 SPI Vs GDP

  • It goes beyond the traditional measure of GDP and has most parameters that are required to fulfil SDGs.
  • One significant difference between GDP and SPI is that SPI focusses on outcomes rather than inputs that are used in GDP.
  • For example, the quality of life and longevity are measured instead of spending on health care, and people’s experience of discrimination is looked at instead of focusing on whether there is a law against discrimination.
  • SPI also reframes the fundamentals about development by taking into consideration not just GDP but also inclusive, sustainable growth that will lead to a significant improvement in people’s lives.
  • SPI can best be described as a complementary index to GDP and can be used along with GDP to achieve social progress.
GPI ( Genuine Progress Indicator)
  • In 1995, Redefining Progress, an economic think tank in Washington, DC, developed the Genuine Progress Indicator (GPI), also known as the Genuine Progress Index
  • GPI is a metric used to measure the economic growth of a country. It is often considered as a replacement or a supplement to the more well-known gross domestic product (GDP) economic indicator.
  • The GPI indicator takes everything the GDP uses into account, but also adds other figures that represent the cost of the negative effects related to economic activity (such as the cost of crime, cost of ozone depletion and cost of resource depletion, among others).
  • The GPI nets the positive and negative results of economic growth to examine whether or not it has benefited people overall.
  • GPI is an attempt to measure whether the environmental impact and social costs of economic production and consumption in a country are negative or positive factors in overall health and well-being.
  • By accounting for the costs borne by the society as a whole to repair or control pollution and poverty, GPI balances GDP spending against external costs.

 What is included in GPI?

  • Time Use
    • Value of Civic and Voluntary Work
    • Value of Unpaid Housework and Child Care
    • Value of Leisure Time
    • Paid Work Hours
  • Living Standards
    • Income and its Distribution
    • Financial Security – Debt and Assets
    • Economic Security Index
  • Natural Capital
    • Soils & Agriculture
    • Forests
    • Fisheries and Marine Resources
    • Energy
    • Air
    • Water
  • Human Impact on the Environment
    • Solid Waste
    • Ecological Footprint
    • Greenhouse Gas Emissions
  • Transportation
    • Human and Social Capital
    • Population Health
    • Costs of Crime
    • Educational Attainment

GDP Vs GPI

The relationship between GDP and GPI is analogous to the relationship between the gross profit of a company and the net profit; the net profit is the gross profit minus the costs incurred, while the GPI is the GDP (value of all goods and services produced) minus the environmental and social costs. Accordingly, the GPI will be zero if the financial costs of poverty and pollution equal the financial gains in production of goods and services, all other factors being constant.

Advantages of Using GPI

  • GDP doesn’t take into account negative externalities of growth. Higher GDP may lead to a large rise in pollution, crime and congestion leaving people with lower economic welfare and lower levels of happiness. Therefore, GDP can be misleading as an account of economic welfare,
  • By focusing on a wider measure of economic indicators, GPI encourages policy makers to think in broader terms of economic welfare and not just crude GDP statistics.
  • GDP only measures output – not how it actually effects people’s living standards and how it is used in society.
  • GPI encourages long term planning. i.e. sustainable growth rather than short term measures which increase GDP at expense of damaging environment.

Disadvantages of Using GPI

  • Many non-economic variables such as value of leisure time / environment are very subjective and it can be difficult to assign an economic value. GDP is simpler and gives less normative results.
  • Not useful for judging state of business cycle.

Conclusion

Rather than GDP v GPI, it is useful to use both and see them as complementary indexes. GDP will always have a use for economic accounting. However, it clearly has limitations. Using an additional measure such as GPI helps to give a better understanding of real economic development.

Inclusive Green Growth and Sustainable Development

Why should development be sustainable?

  • Sustainable economic development means ‘development should take place without damaging the environment, and development in the present should not compromise with the needs of the future generations.
  • At the international level, the Club of Rome advocated resource conservation for the first time in a systematic manner in 1968. Subsequently, in 1974, Gandhian philosophy was once again presented by Schumacher in his book ‘Small is Beautiful’.
  • An important contribution with respect to resource conservation at the global level was made by the Brundtland Commission Report, 1987. This report introduced the concept of ‘Sustainable Development’ and advocated it as a means for resource conservation, which was subsequently published in a book, entitled “Our Common Future”.
  • Another significant contribution was made at the Earth Summit at Rio de Janeiro, Brazil in 1992.
  • Sustainable development ties together concern for the carrying capacity of natural systems with the social challenges faced by humanity.
  • As early as the 1970s, “sustainability” was employed to describe an economy “in equilibrium with basic ecological support systems.” Ecologists have pointed to The Limits to Growth, and presented the alternative of a “steady state economy” in order to address environmental concerns.

The carrying capacity of a biological species in an environment is the maximum population size of the species that the environment can sustain indefinitely, given the food, habitat, water, and other necessities available in the environment.

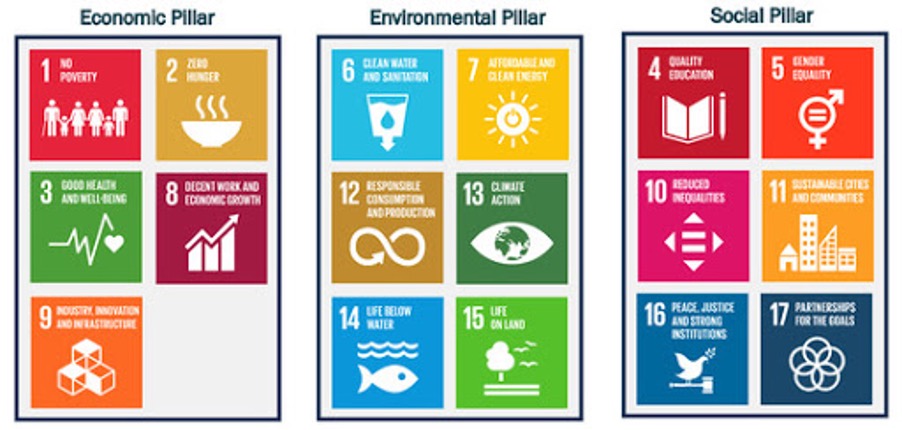
Components of Sustainable Development

The United Nations 2005 World Summit Outcome Document refers to the “interdependent and mutually reinforcing pillars” (i.e., components) of sustainable development as
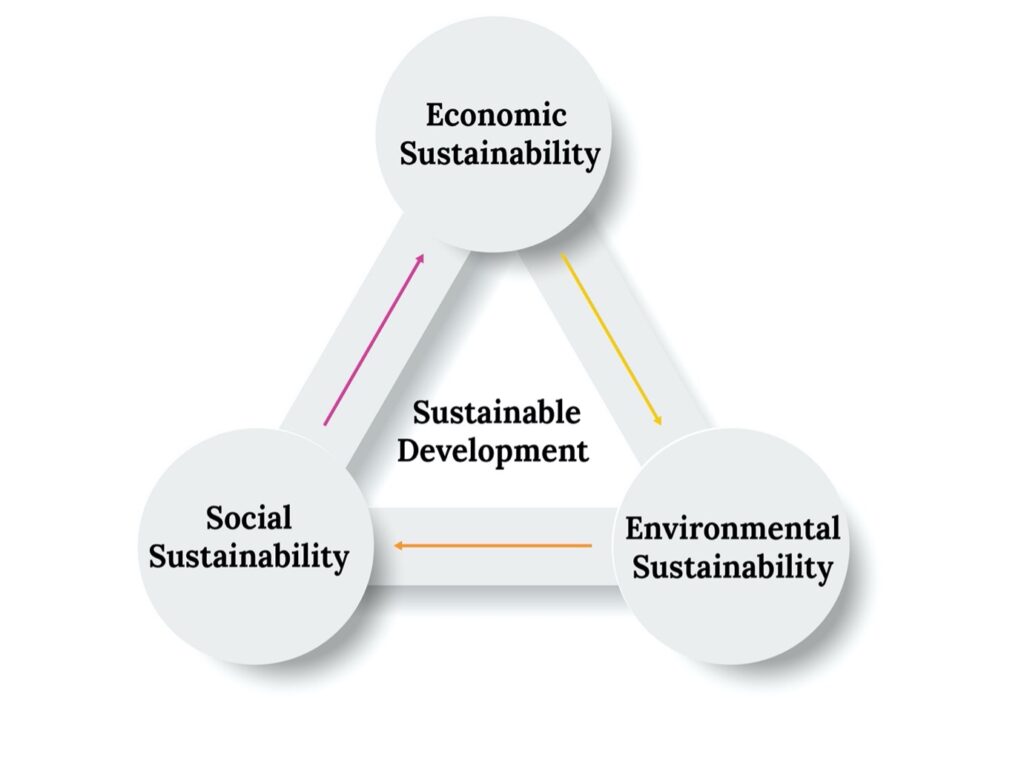
  • Environmental Sustainability
  • Economic Sustainability and
  • Socio-political Sustainability

Green Development Vs Sustainable Development

Green development is generally differentiated from sustainable development in that Green development prioritizes what its proponents consider to be environmental sustainability over economic and cultural considerations. Proponents of Sustainable Development argue that it provides a context in which to improve overall sustainability where cutting edge Green Development is unattainable.

Inclusive green growth is the pathway to sustainable development. It is the best way to reconcile the rapid growth required to bring developing countries to the level of prosperity to which they aspire, meet the needs of the more than 1 billion people still living in poverty, and fulfil the global imperative of a better environment.

What’s next?
Neither growth nor development in an economy is constant forever. Just like how everyone faces ups and downs in their life, any country’s economy goes through the same. These are called the business cycles in economic parlance.

So let us now understand what they are.

Topics Covered

  • Growth Vs Development
  • Economic Growth Vs Economic Development
  • Exclusive and Inclusive growth
  • Measures/ Indexes of Development
    • Human Development Index
    • Gross National Happiness Index
    • Gender Inequality Index
    • Gender Development Index
    • Human Poverty Index (HPI)
    • Multidimensional Poverty Index
    • Physical Quality of Life Index
    • Social Progress Index
    • Genuine Progress Indicator


Growth Vs Development

  • The term Growth and Development are near synonymous but not the same thing. Both growth and development refer to changes over a time period. Both express the idea of increase, but growth means an increase in quantity, while development is about quality.
  • Growth can be both positive and negative like GDP whereas development is always positive as it shows quality improvement like Education, Basic amenities, Infrastructure, Manufacturing etc.,
  • Development is basically a positive growth in addition to quality.
  • As we understood the difference between growth and development. Let’s try to understand Economic Growth and Economic Development.


Economic Growth Vs Economic Development

Economic Growth:

Economic Growth is defined as the rise in the money value of goods and services produced by all the sectors of the economy per head during a particular period. It is a quantitative measure that shows the increase in the number of commercial transactions in an economy.

Determinants of Economic Growth

Economic growth can be expressed in terms of gross domestic product (GDP) and gross national product (GNP), that helps in measuring the size of the economy. It lets us compare in absolute and percentage change, i.e. how much an economy has progressed since last year. It is an outcome of the increase in the quality and quantity of resources and advancement of technology.


Economic Development:

  • Economic Development is defined as the process of increase volume of production along with the improvement in technology, a rise in the level of living, institutional changes, etc. In short, it is the progress in the socio-economic structure of the economy.


  • Human Development Index (HDI) is the appropriate tool to gauge the development in the economy. Based on the development, the HDI statistics rank countries. It considers the overall development in an economy regarding the standard of living, GDP, living conditions, technological advancement, improvement in self-esteem needs, the creation of opportunities, per capita income, infrastructural and industrial development and much more.


Difference between Economic Growth and Economic Development

The fundamental differences between economic growth and development are explained in the points given below:


  1. Economic growth is the positive change in the real output of the country in a particular span of time economy. Economic Development involves a rise in the level of production in an economy along with the advancement of technology, improvement in living standards and so on.
  2. Economic growth is one of the features of economic development.
  3. Economic growth is an automatic process. Unlike economic development, which is the outcome of planned and result-oriented activities.
  4. Economic growth enables an increase in the indicators like GDP, per capita income, etc. On the other hand, economic development enables improvement in the life expectancy rate, infant mortality rate, literacy rate and poverty rates.
  5. Economic growth can be measured when there is a positive change in the national income, whereas economic development can be seen when there is an increase in real national income.
  6. Economic growth is a short-term process which takes into account yearly growth of the economy. But if we talk about economic development it is a long term process.
  7. Economic Growth applies to developed economies to gauge the quality of life, but as it is an essential condition for the development, it applies to developing countries also. In contrast to, economic development applies to developing countries to measure progress.
  8. Economic Growth results in quantitative changes, but economic development brings both quantitative and qualitative changes.
  9. Economic growth can be measured in a particular period. As opposed to economic development is a continuous process so that it can be seen in the long run.


Let’s try to understand the two terms economic growth and economic development, we will take an example of a human being.

  • The term growth of human beings simply means the increase in their height and weight which is purely physical. But if you talk about human development, it will take into account both the physical and abstract aspects like maturity level, attitudes, habits, behaviour, feelings, intelligence and so on.
  • In the same manner, growth of an economy can be measured through the increase in its size in the current year in comparison to previous years, but economic development includes not only physical but also non-physical aspects that can only be experienced like improvement in the lifestyle of the inhabitants, increase in individual income, improvement in technology and infrastructure, etc.


Exclusive and Inclusive growth

Exclusive growth:

  • Exclusive growth is one where the fruits or benefits of growth are not equitably shared among the people of a country.
  • It could also lead to a condition of jobless growth that was seen in India during the past decade.
  • It could lead to a scenario of the rich getting richer and the poor, poorer.
  • Very few people will be sharing a very large part of the countries resources and there would be no egalitarianism.
  • Exclusive growth leads to poverty, unemployment, regional disparities, Income disparities, etc.,
  • Let’s understand this with an example – The richest 1% in the United States now own more wealth than the bottom 90 %. Wealth includes the values of homes, automobiles, personal valuables, businesses, savings, and investments.


Inclusive growth:

  • Inclusive growth is defined as “the process and the outcome where all groups of people have participated in growth and have benefited equitably from it”. This implies that inclusive growth should include all sections as beneficiaries as well as partners in growth and that inclusion of the excluded should be embodied in the growth process.
  • Inclusive growth is the growth that reduces disparities among per capita incomes in agriculture and non-agriculture, in rural and urban areas, and in different socio-economic groups, particularly between men and women and among different ethnic groups.
  • The result of inclusive growth is reduction in vertical inequalities (individual inequalities) and horizontal inequalities (group inequalities).
  • Inclusive growth means economic growth that creates employment opportunities and helps in reducing poverty. It means having access to essential services in health and education by the poor. It includes providing equality of opportunity, empowering people through education and skill development.
  • It also encompasses a growth process that is environment-friendly growth, aims for good governance and helps in creation of a gender-sensitive society.


Let’s understand Inclusiveness with an example –

In a cricket team, the most acceptable player is the one who has a good control over his batting, bowling and fielding making him an all-rounder. So, when it comes to an all-rounder economy it is accepted as an effective growth which includes all the aspects of development and progress as its priority i.e., not only economic aspects but also social-justice and welfare aspects too.


  • This sort of growth is considered as inclusive growth where what is produced or how much is produced is kept in parallel with for whom it has been produced, and most importantly how many are being benefited with such production.
  • The basis to attain such growth is broad which involves economic, social, political and geographical aspects being as base for any developing country.

Now that we have understood what growth and development and its various facets are, let’s look at some measures of development.


Measures of Development


  1. Human Development Index
  • The Human Development Index (HDI) is a statistical tool used to measure a country’s overall achievement in its social and economic dimensions. The social and economic dimensions of a country are based on the health of people, their level of educational attainment and their standard of living.
  • Pakistani economist Mahbub-ul-Haq created HDI in 1990 which was further used to measure the country’s development by the United Nations Development Program (UNDP).


Calculation of the index combines four major indicators:

  1. Life expectancy for health,
  2. Expected years of schooling,
  3. Mean of years of schooling for education and
  4. Gross National Income per capita for the standard of living.


Why do we require HDI?

  • Firstly, GDP method of calculating progress ignores non-income aspects like education and health thus, for example, Arab countries have high GDP per-capita, but the progress in health and education field is limited in those countries which do not get measured in GDP. Similarly, in countries like Cuba and Sri Lanka GDP per capita is low, but the quality of life is much better than many high GDP per capita countries of the Arab world and Latin America because of high-quality indicators in social sectors. HDI will overcome this problem
  • Secondly, GDP per capita ignores income inequality or distribution of wealth in a country for example in countries of Latin America have high GDP per capita but due to skewed income distribution, the masses are excluded from growth process.
  • The HDI was created to emphasize that people and their capabilities should be the ultimate criteria for assessing the development of a country, not economic growth alone


Method of calculating HDI

  • The Human Development Index (HDI) is a summary measure of average achievement in key dimensions of human development: a long and healthy life, being knowledgeable and have a decent standard of living.
  • The HDI is the geometric mean of normalized indices for each of the three dimensions.

(a) Life Expectancy Index assessment

The minimum value for life expectancy is fixed at 20 years in the new calculation. The maximum value for life index is kept at 83.2 years.

(b) Education Index assessment

Education Index (EI) assessment is composite of two indices. They are

  1. Mean Years of Schooling Index (MYSI)
  2. Expected Years of Schooling Index (EYSI)

(c) Income Index assessment

  • To calculate this index, goal posts are set as per observations during 1980 – 2010 in various countries. Gross National Income per capita is taken as a measure to calculate new Income Index in new HDI. Minimum income is set as $163, and maximum income is set as $108,211.


How to calculate Human Development Index as per new method?

  • Formula to calculate Human Development Index (HDI) = (Life Expectancy Index x Education Index x Income Index) 1/3
  • New Human Development Index (HDI) is geometric mean of Life Expectancy Index (LEI), Education Index (EI) and Income Index (II).
  • After this calculation total value will be between 0 and 1. As per the values gained, countries will be placed in the list of the division of countries. They are divided into very high human development, high human development, medium high human development and low high human development countries


Inequality-adjusted Human Development Index

  • The 2010 HDR introduced the Inequality-Adjusted HDI (IHDI), which takes into account inequality in all three dimensions of the HDI by ‘discounting’ each dimension’s average value according to its level of inequality.
  • The IHDI is basically the HDI discounted for inequalities. The ‘loss’ in human development due to inequality is given by the difference between the HDI and the IHDI, and can be expressed as a percentage.
  • As the inequality in a country increases, the loss in human development also increases.
  • The IHDI takes into account not only the average achievements of a country on health, education and income, but also how those achievements are distributed among its population by “discounting” each dimension’s average value according to its level of inequality.
  • While the HDI can be viewed as an index of average achievements in human development dimensions, the IHDI measures the level of human development when the distribution of achievements across people in the society is accounted for.
  • The IHDI will be equal to the HDI when there is no inequality, but falls below the HDI as inequality rises. The difference between the HDI and IHDI, expressed as a percentage of the HDI, indicates the loss in human development due to inequality.
  • The IHDI captures the inequality in distribution of the HDI dimensions.
  • However, it is not association sensitive, meaning that it does not account for overlapping inequalities—whether the same people are at the lower end of each distribution.
  • Also, individual values of education and income can be zero or even negative (for income), so they have been adjusted to non-negative non-zero values uniformly across countries.


  1. Gross National Happiness Index
  • Gross National Happiness is a term coined by his Majesty the fourth King of Bhutan, Jigme Singye Wangchuck in the 1970s. The concept implies that sustainable development should take a holistic approach towards notions of progress and give equal importance to non-economic aspects of well-being.
  • “How are you?” We ask that question of one another often. But how are we doing – as a country, a society? To answer that question, Bhutan uses its Gross National Happiness (GNH) Index.
  • GNH is a much richer objective than GDP or economic growth. In GNH, material well-being is important, but it is also important to enjoy sufficient well-being in things like community, culture, governance, knowledge and wisdom, health, spirituality and psychological welfare, a balanced use of time, and harmony with the environment.

The concept of GNH has often been explained by its four pillars:

  1. Good governance,
  2. Sustainable Socio-Economic Development,
  3. Cultural Preservation, and
  4. Environmental Conservation

​​​​​

​​Lately the four pillars have been further classified into nine domains in order to create widespread understanding of GNH and to reflect the holistic range of GNH values.


The nine domains are:

  1. Psychological well-being,
  2. Health,
  3. Education,
  4. Time use,
  5. Cultural diversity and resilience,
  6. Good governance,
  7. Community vitality,
  8. Ecological diversity and resilience, and
  9. Living standards.
  • The domains represents each of the components of well-being of the Bhutanese people, and the term ‘well-being’ here refers to fulfilling conditions of a ‘good life’ as per the values and principles laid down by the concept of Gross National Happiness.
  • The Gross National Happiness Index is a single number index developed from 33 indicators categorized under nine domains.
  • The GNH Index is constructed based upon a robust multidimensional methodology known as the Alkire-Foster method.
  1. Gender Inequality Index
  • The Gender Inequality Index (GII) is an inequality index. It shows the loss in potential human development due to disparity between female and male achievements in two dimensions, empowerment and economic status, and reflects a country’s position relative to normative ideals for the key dimension of women’s health. Overall, the GII reflects how women are disadvantaged in these dimensions.
  • There is no country with perfect gender equality – hence all countries suffer some loss in achievements in key aspects of human development when gender inequality is taken into account.
  • The GII is similar in method to the Inequality-adjusted Human Development Index (IHDI). It can be interpreted as a combined loss to achievements in reproductive health, empowerment and labour market participation due to gender inequalities.
  • Since the GII includes different dimensions than the HDI, it cannot be interpreted as a loss in HDI itself. The GII ranges between 0 and 1 and higher GII values indicate higher levels of inequalities.
  • The GII includes reproductive health and goes beyond the literacy and primary education. It also reveals gender disparities in labour market participation, instead of using the flawed sex-disaggregated income measure.
  • Like all composite measures, the GII has some limitations.
  • First, it does not capture the length and breadth of gender inequality. For example, the use of national parliamentary representation excludes participation at the local government level and elsewhere in community and public life.
  • The labour market dimension lacks information on employment, having an adequate job, and unpaid work that is mostly done by women.
  • The index misses other important dimensions, such as time use – the fact that many women have the additional burden of care giving and housekeeping cuts into their leisure time and increases stress and physical exhaustion.
  • Asset ownership, child care support, gender-based violence and participation in community decision-making are also not captured in the GII, mainly due to limited data availability.


  1. Gender Development Index
  • In the 2014 HDR, a new measure was introduced, the Gender Development Index (GDI) based on the sex-disaggregated Human Development Index, defined as a ratio of the female to the male HDI.
  • The GDI measures differences between male and female achievements in three basic dimensions of human development health, measured by female and male life expectancy at birth; education measured by female and male expected years of schooling for children and female and male mean years of schooling for adults ages 25 and older, and equitable command over economic resources measured by female and male estimated earned income.
  • To calculate the GDI, the HDI is calculated separately for females and for males using the same methodology as in the HDI. The same goalposts as in the HDI are used for transforming the indicators into a scale between zero and one. The only exception is life expectancy at birth where calculations are adjusted for the average of five years biological advantage that women have over men.
  • The GDI provides insights into gender disparities in achievements in three basic capabilities: health, education and command over economic resources.
  • It helps further understanding of the real gender gap in human development achievements and is useful for navigating policies to close the gap.


  1. Human Poverty Index (HPI)
  • The Human Poverty Index (HPI) devised by United Nations (UN) which gave an indication of the standard of living in a country. It complemented the Human Development Index (HDI) and was first reported as part of the Human Development Report in 1997.
  • Traditionally poverty has been measured as lack of income—but this is far too narrow a definition. Human poverty is a thought that catches the numerous dimensions of poverty that exist in both poor and rich nations – it is the refusal of decisions and chances for carrying on with a life one has motivation to esteem.
  • The HPI-1—human poverty index for developing countries—measures human deprivations in the same three aspects of human development as the HDI (longevity, knowledge and a decent standard of living).

For HPI – 1 (Developing Countries): deprivations in life span are measured by the probability at birth of not surviving due to age 40; deprivations in information are measured by the rate of grown – ups who are illiterate; deprivations in a respectable expectation for everyday comforts measured by two variables.


HPI-2— human poverty index for selected high-income OECD countries— includes, in addition to the three dimensions in HPI-1, social exclusion.


For HPI-2 (selected high-income OECD countries): deprivations in life span are measured by the probability at birth of not achieving age of 60; deprivations in information are measured by the rate of mature people needing practical proficiency aptitudes; deprivations in an average expectation for everyday comforts are measured by the rate of individuals living underneath the income poverty line, set at half of the balanced average family disposable salary; and social rejection is measured by the rate of long haul (12 months or more) unemployment of the work power.


How is the HPI used?

  • To guide national planning for poverty alleviation. Many National Human Development Reports now break down the HPI by region or other socioeconomic groups to identify the areas or social groups within the country most deprived in terms of human poverty. The results can be dramatic, creating national debate and helping in reframing and reshaping of policies.
  • To focus attention on the most deprived people and deprivations in basic human capabilities in a country, not on average national achievement. The HPI focuses directly on the number of people living in poverty—presenting a very different picture from average national achievement. It also moves the focus of poverty debates on other concerns also and not poverty alone.
  • To shed light on the presence of human poverty in both the rich/poor or developed/undeveloped countries. High per capita income is no guarantee of a poverty-free country. Even in the richest countries, there is human poverty. The HPI-2 for selected high-income OECD countries (HPI-2) reveals that out of 17 European and North American countries, the U.S. has the 2nd highest per capita income , but also the highest rate of human poverty.


  1. Multidimensional Poverty Index (MPI)
  • The Global Multidimensional Poverty Index (MPI) was developed in 2010 by the Oxford Poverty & Human Development Initiative (OPHI) and the United Nations Development Programme and uses different factors to determine poverty beyond income-based lists.
  • It replaced the previous Human Poverty Index. The global MPI is released annually by OPHI.
  • The global Multidimensional Poverty Index (MPI) is an international measure of acute poverty covering over 100 developing countries. It complements traditional income-based poverty measures by capturing the severe deprivations that each person faces at the same time with respect to education, health and living standards.
  • The MPI assesses poverty at the individual level. If someone is deprived in a third or more of ten (weighted) indicators, the global index identifies them as ‘MPI poor’, and the extent – or intensity – of their poverty is measured by the number of deprivations they are experiencing.
  • If the household deprivation score is 33.3 percent or greater, the household (and everyone in it) is classed as multi-dimensionally poor. Households with a deprivation score greater than or equal to 20 percent but less than 33.3 percent are near multidimensional poverty.
  • The MPI can be used to create a comprehensive picture of people living in poverty, and permits comparisons both across countries, regions and the world and within countries by ethnic group, urban/rural location, as well Each dimension and each indicator within a dimension is equally weighted.


The components of MPI are:

  1. Education (each indicator is weighted equally at 1/6)
  • Years of Schooling: deprived if no household member has completed five years of schooling
  • Child Enrolment: deprived if any school-aged child is not attending school in years 1 to 8
  1. Health (each indicator is weighted equally at 1/6)
  • Child Mortality: deprived if any child has died in the family
  • Nutrition: deprived if any adult or child for whom there is nutritional information is malnourished
  1. Standard of Living (each indicator is weighted equally at 1/18)
  • Electricity: deprived if the household has no electricity
  • Drinking water: deprived if the household does not have access to clean drinking water or clean water is more than 30 minute’s walk from home
  • Sanitation: deprived if they do not have an improved toilet or if their toilet is shared
  • Flooring: deprived if the household has dirt, sand or dung floor
  • Cooking Fuel: deprived if they cook with wood, charcoal or dung
  • Assets: deprived if the household does not own more than one of: radio, TV, telephone, bike, or motorbike, and do not own a car or tractor.

The above characteristic make the MPI useful as an analytical tool to identify the most vulnerable people – the poorest among the poor, revealing poverty patterns within countries and over time, enabling policy makers to target resources and design policies more effectively.


  1. Physical Quality of Life Index (PQLI)
  • The Physical Quality of Life Index (PQLI) is an attempt to measure the quality of life or well-being of a country.
  • The value is the average of three statistics: basic literacy rate, infant mortality, and life expectancy at age one, all equally weighted on a 0 to 100 scale.
  • It was developed for the Overseas Development Council in the mid-1970s by Morris David Morris, as one of a number of measures created due to dissatisfaction with the use of GNP as an indicator of development.

Limitations of PQLI

  • PQLI might be regarded as an improvement, but shares the general problems of measuring quality of life in a quantitative way. It has also been criticized because there is considerable overlap between infant mortality and life expectancy.
  • The UN Human Development Index is a more widely used means of measuring well-being.


Steps to Calculate Physical Quality of Life:


  1. Find percentage of the population that is literate (literacy rate).
  2. Find the infant mortality rate. (out of 1000 births).

Indexed Infant Mortality Rate = (166 – infant mortality) × 0.625

  1. Find the Life Expectancy.

Indexed Life Expectancy = (Life expectancy – 42) × 2.7

  1. Physical Quality of Life = (Literacy Rate + INDEXED Infant Mortality Rate + INDEXED Life Expectancy) / 3


Usefulness of PQLI

  • The PQLI informs about the changing distribution of social benefits among countries, between the sexes, among ethnic groups, and by region and sector.
  • The PQLI facilitates international and regional comparisons by minimizing developmental and cultural ethnocentricities.
  • As the gap closes between current performance and maximum attainable performance, the gaps between PQLI indices should close.
  • The PQLI, with signs of lowered infant mortality and lengthened life expectancy, paints a less fatalistic pessimistic picture than the GNP.


  1. Social Progress Index (SPI)
  • The Social Progress Index measures the extent to which countries provide for the social and environmental needs of their citizens.
  • Fifty-four indicators in the areas of basic human needs, foundations of well-being, and opportunity to progress show the relative performance of nations.
  • The index is published by the non-profit Social Progress Imperative, and is based on the writings of Amartya Sen, Douglass North, and Joseph Stiglitz.
  • The SPI measures the well-being of a society by observing social and environmental outcomes directly rather than the economic factors.
  • The social and environmental factors include wellness (including health, shelter and sanitation), equality, inclusion, sustainability and personal freedom and safety.
  • The index defines social progress as the capacity of a society to meet the basic human needs of its citizens, establish the building blocks that allow citizens and communities to enhance and sustain the quality of their lives, and create the conditions for all individuals to reach their full potential.


Two key features of the Social Progress Index are:

  1. The exclusion of economic variables
  2. The use of outcome measures rather than inputs


Usefulness Of SPI

  • The primary goal of the Social Progress Index is to provide a rigorous tool to benchmark progress and stimulate progress within countries.
  • Social progress depends on the policy choices, investments, and implementation capabilities of multiple stakeholders—government, civil society, and business. By informing and motivating those stake holders to work together and develop a more holistic approach to development, social progress will be accelerated.


SPI Vs GDP

  • It goes beyond the traditional measure of GDP and has most parameters that are required to fulfil SDGs.
  • One significant difference between GDP and SPI is that SPI focusses on outcomes rather than inputs that are used in GDP.
  • For example, the quality of life and longevity are measured instead of spending on health care, and people’s experience of discrimination is looked at instead of focusing on whether there is a law against discrimination.
  • SPI also reframes the fundamentals about development by taking into consideration not just GDP but also inclusive, sustainable growth that will lead to a significant improvement in people’s lives.
  • SPI can best be described as a complementary index to GDP and can be used along with GDP to achieve social progress.


  1. GPI ( Genuine Progress Indicator)
  • In 1995, Redefining Progress, an economic think tank in Washington, DC, developed the Genuine Progress Indicator (GPI), also known as the Genuine Progress Index
  • GPI is a metric used to measure the economic growth of a country. It is often considered as a replacement or a supplement to the more well-known gross domestic product (GDP) economic indicator.
  • The GPI indicator takes everything the GDP uses into account, but also adds other figures that represent the cost of the negative effects related to economic activity (such as the cost of crime, cost of ozone depletion and cost of resource depletion, among others).
  • The GPI nets the positive and negative results of economic growth to examine whether or not it has benefited people overall.
  • GPI is an attempt to measure whether the environmental impact and social costs of economic production and consumption in a country are negative or positive factors in overall health and well-being.
  • By accounting for the costs borne by the society as a whole to repair or control pollution and poverty, GPI balances GDP spending against external costs.


What is included in GPI?

  • Time Use
    • Value of Civic and Voluntary Work
    • Value of Unpaid Housework and Child Care
    • Value of Leisure Time
    • Paid Work Hours
  • Living Standards
    • Income and its Distribution
    • Financial Security – Debt and Assets
    • Economic Security Index
  • Natural Capital
    • Soils & Agriculture
    • Forests
    • Fisheries and Marine Resources
    • Energy
    • Air
    • Water
  • Human Impact on the Environment
    • Solid Waste
    • Ecological Footprint
    • Greenhouse Gas Emissions
  • Transportation
    • Human and Social Capital
    • Population Health
    • Costs of Crime
    • Educational Attainment


GDP Vs GPI

The relationship between GDP and GPI is analogous to the relationship between the gross profit of a company and the net profit; the net profit is the gross profit minus the costs incurred, while the GPI is the GDP (value of all goods and services produced) minus the environmental and social costs. Accordingly, the GPI will be zero if the financial costs of poverty and pollution equal the financial gains in production of goods and services, all other factors being constant.


Advantages of Using GPI

  • GDP doesn’t take into account negative externalities of growth. Higher GDP may lead to a large rise in pollution, crime and congestion leaving people with lower economic welfare and lower levels of happiness. Therefore, GDP can be misleading as an account of economic welfare,
  • By focusing on a wider measure of economic indicators, GPI encourages policy makers to think in broader terms of economic welfare and not just crude GDP statistics.
  • GDP only measures output – not how it actually effects people’s living standards and how it is used in society.
  • GPI encourages long term planning. i.e. sustainable growth rather than short term measures which increase GDP at expense of damaging environment.

Disadvantages of Using GPI

  • Many non-economic variables such as value of leisure time / environment are very subjective and it can be difficult to assign an economic value. GDP is simpler and gives less normative results.
  • Not useful for judging state of business cycle.


Conclusion

Rather than GDP v GPI, it is useful to use both and see them as complementary indexes. GDP will always have a use for economic accounting. However, it clearly has limitations. Using an additional measure such as GPI helps to give a better understanding of real economic development.


Why should development be sustainable?

  • Sustainable economic development means ‘development should take place without damaging the environment, and development in the present should not compromise with the needs of the future generations.
  • At the international level, the Club of Rome advocated resource conservation for the first time in a systematic manner in 1968. Subsequently, in 1974, Gandhian philosophy was once again presented by Schumacher in his book ‘Small is Beautiful’.
  • An important contribution with respect to resource conservation at the global level was made by the Brundtland Commission Report, 1987. This report introduced the concept of ‘Sustainable Development’ and advocated it as a means for resource conservation, which was subsequently published in a book, entitled “Our Common Future”.
  • Another significant contribution was made at the Earth Summit at Rio de Janeiro, Brazil in 1992.
  • Sustainable development ties together concern for the carrying capacity of natural systems with the social challenges faced by humanity.
  • As early as the 1970s, “sustainability” was employed to describe an economy “in equilibrium with basic ecological support systems.” Ecologists have pointed to The Limits to Growth, and presented the alternative of a “steady state economy” in order to address environmental concerns.

The carrying capacity of a biological species in an environment is the maximum population size of the species that the environment can sustain indefinitely, given the food, habitat, water, and other necessities available in the environment.


Components of Sustainable Development

The United Nations 2005 World Summit Outcome Document refers to the “interdependent and mutually reinforcing pillars” (i.e., components) of sustainable development as


  1. Environmental Sustainability
  2. Economic Sustainability and
  3. Socio-political Sustainability.


Green Development Vs Sustainable Development


Green development is generally differentiated from sustainable development in that Green development prioritizes what its proponents consider to be environmental sustainability over economic and cultural considerations. Proponents of Sustainable Development argue that it provides a context in which to improve overall sustainability where cutting edge Green Development is unattainable.


Inclusive Green Growth and Sustainable Development


Inclusive green growth is the pathway to sustainable development. It is the best way to reconcile the rapid growth required to bring developing countries to the level of prosperity to which they aspire, meet the needs of the more than 1 billion people still living in poverty, and fulfil the global imperative of a better environment.


What’s next?

Neither growth nor development in an economy is constant forever. Just like how everyone faces ups and downs in their life, any country’s economy goes through the same. These are called the business cycles in economic parlance.

So let us now understand what they are.


Related Posts

Leave a Reply

My New Stories